Analyzing B2C campaigns
Oracle Unity allows you to investigate problematic campaigns, identify the groups of customers that are responsible for the poor performance, and re-target the problematic customers. After identifying a campaign is not performing as expected, you select it along with similar campaigns to use as a baseline of comparison. Once on the Campaign analysis page, you do the analysis by looking at how different groups of customers in the investigated campaign performed compared to the same group of customers in the similar campaigns. This analysis allows you to identify which customers in the investigated campaign performed comparatively worse. The final step is creating a segment of the problematic customers so that you can re-target them in a new campaign.
Campaign analysis involves the following tasks:
- Step 1: Open the investigation. Select the campaign from the One time campaigns page. You will also need to select similar campaigns to get a baseline of comparison.
- Step 2: Analyze the campaign. Analyze customers in the investigated campaign across different attributes to find the ones that are the cause of the poor performance.
- Step 3: Create a segment. Based on the results of the investigation, create a segment of the problematic customers to re-target in a campaign.
Step 1: Open the investigation
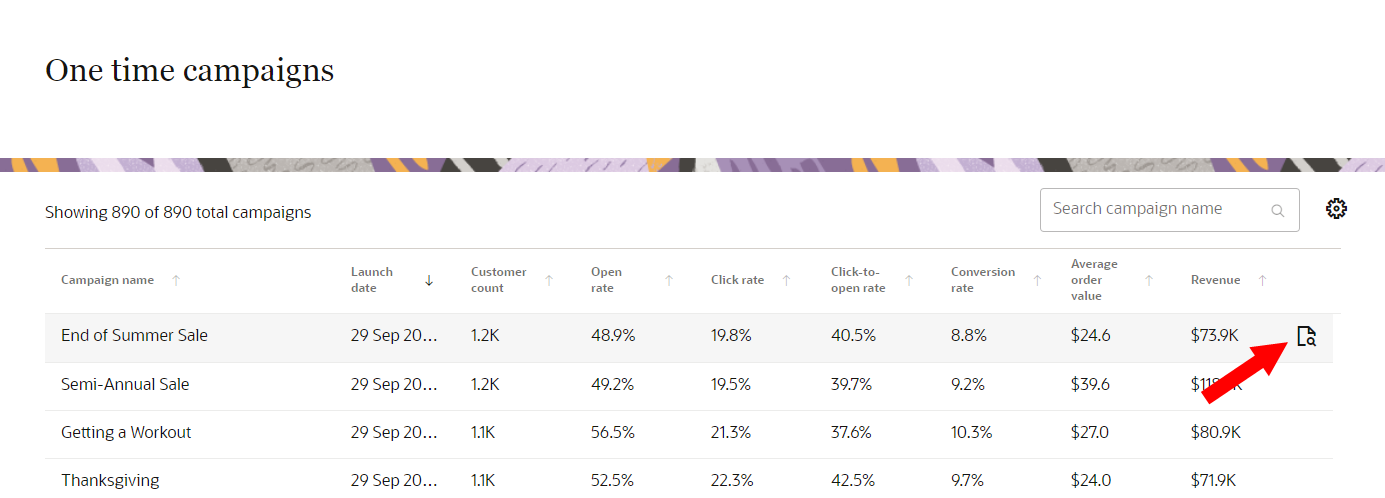
After noticing a one time campaign has abnormal performance, you can start investigating it from the One time campaigns page. You will need to select the campaign you are investigating as well as up to three similar campaigns to use as a baseline of comparison.
To start an investigation:
-
Click the Oracle icon
 in the bottom-right corner to open the navigation menu.
- Select One time campaigns.
- Hover your mouse over the campaign you want to investigate. The investigate icon
 will appear next to the far-right column. Click the icon to start the investigation.
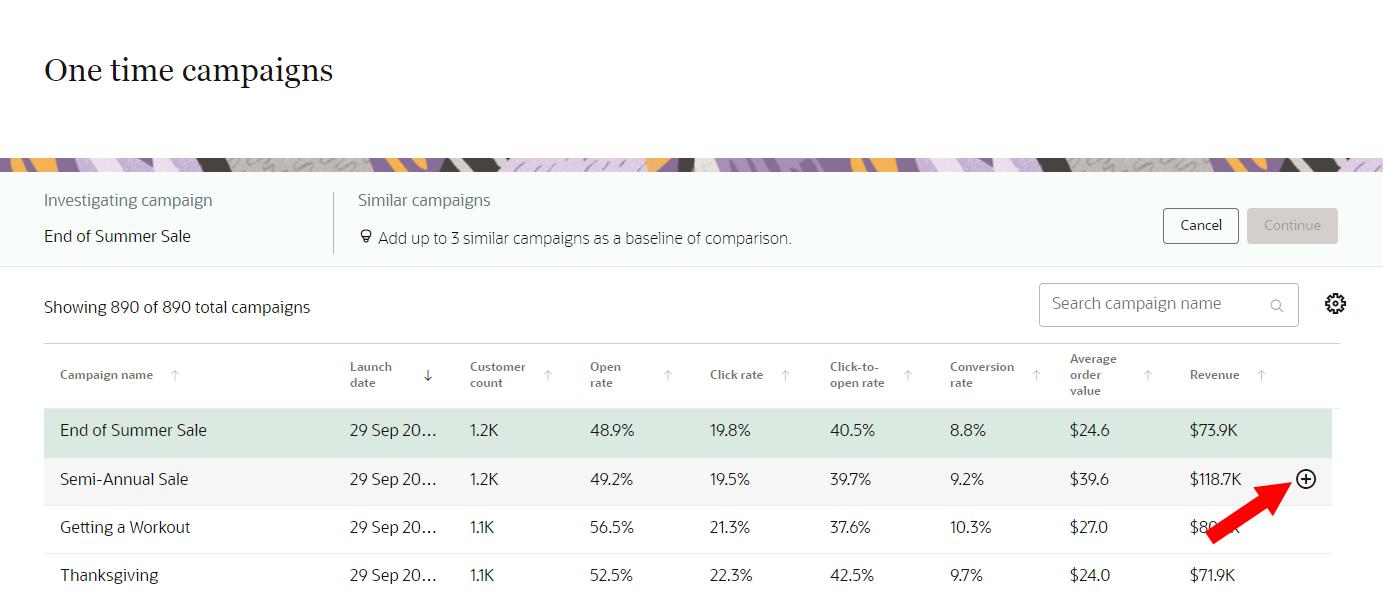
 - Find up to three campaigns to use for comparison. For each similar campaign, hover your mouse over the campaign. The add campaign icon
 will appear next to the far-right column. Click the icon to add the campaign as a similar campaign for the investigation.
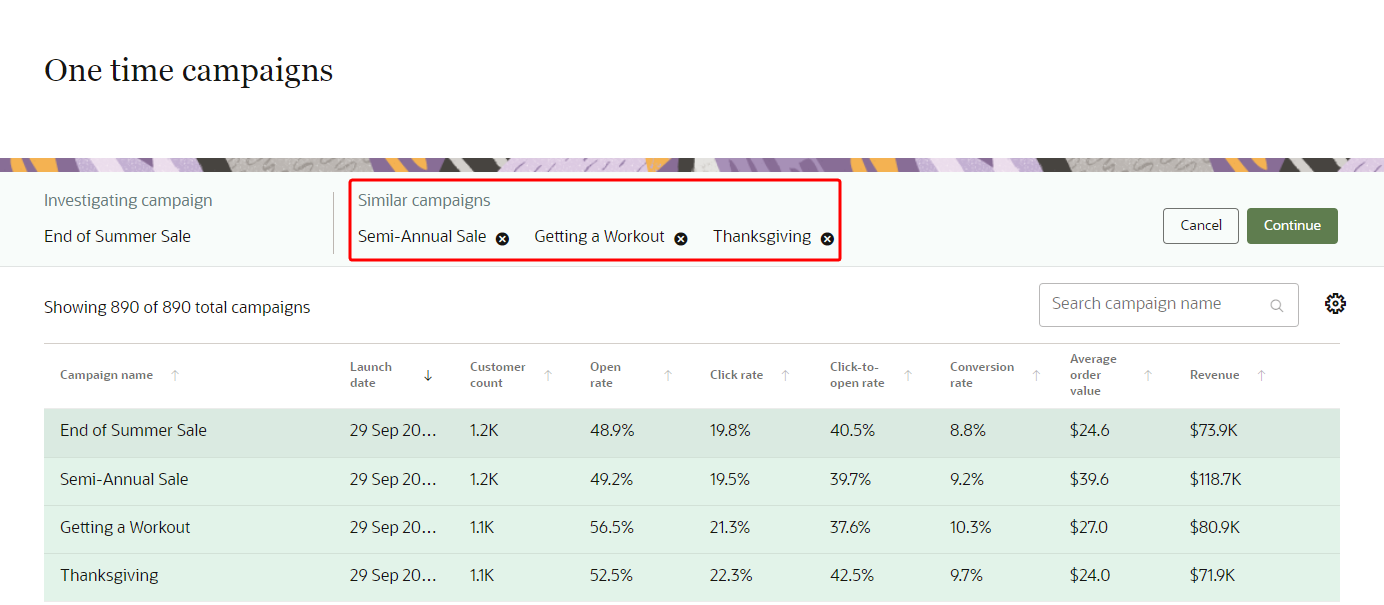
 - When done selecting campaigns, click Continue. The Campaign analysis page will open.
Note: If you are on the homepage, you can also go directly to the One time campaigns page by clicking Details in the One time campaigns widget.
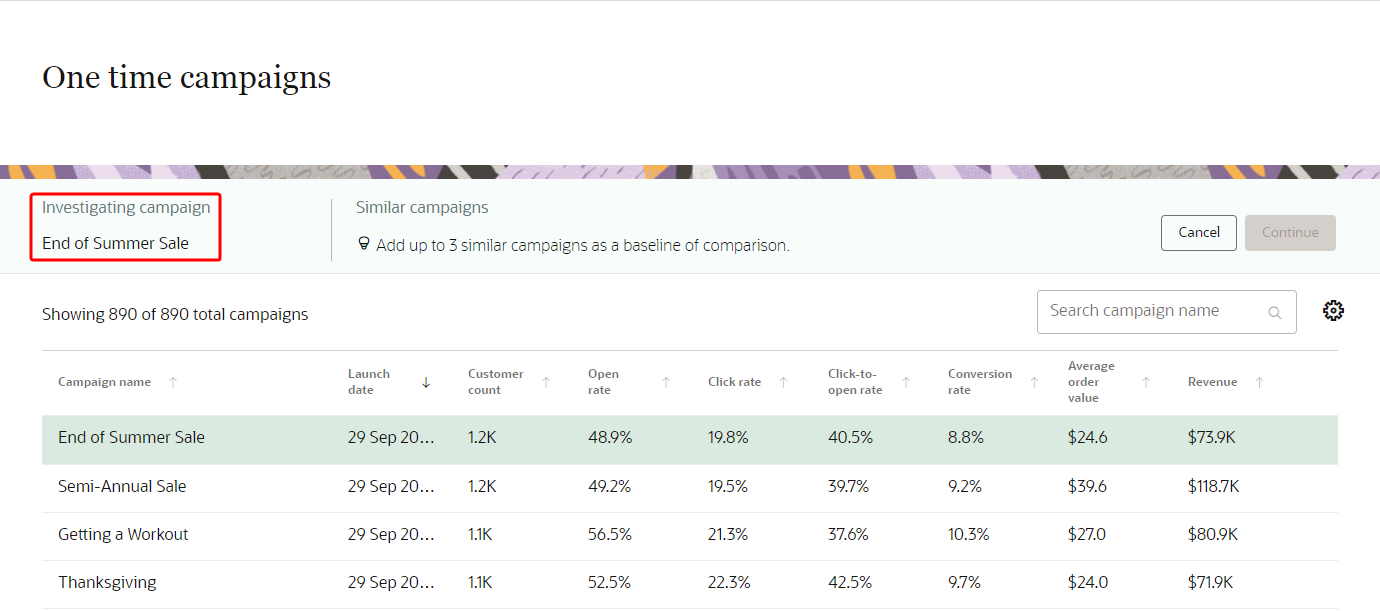
You will see the campaign added at the top of the page. You will be prompted to add up to three similar campaigns for comparison.
You will see the added campaigns at the top of the page.
Step 2: Analyze the campaign
Based on the campaigns you have selected for investigation, you complete campaign analysis by comparing the performance of the investigated campaign against the baseline performance of the similar campaigns. You select different metrics and see how customers across several attributes in the investigated campaign performed compared to the same groups of customers in the similar campaigns. Attributes you select for analysis are displayed in the comparison matrix, which displays the relative performance of those attributes. The bottom of the page shows the breakdown of performance and customer count for all of the campaigns selected for the analysis.
You can do campaign analysis by reviewing and working with the different elements:
After completing your analysis and identifying a group of customers you would like to re-target in a campaign, you can automatically create a segment of those customers on the segmentation canvas.
Campaign analysis indicators
The Campaign analysis page has indicators that allow you to keep track of your campaign analysis, view the metric value and customer count of the investigated campaign, make changes to the metric selected, and review the attribute values you have added for analysis. This section has the following elements.
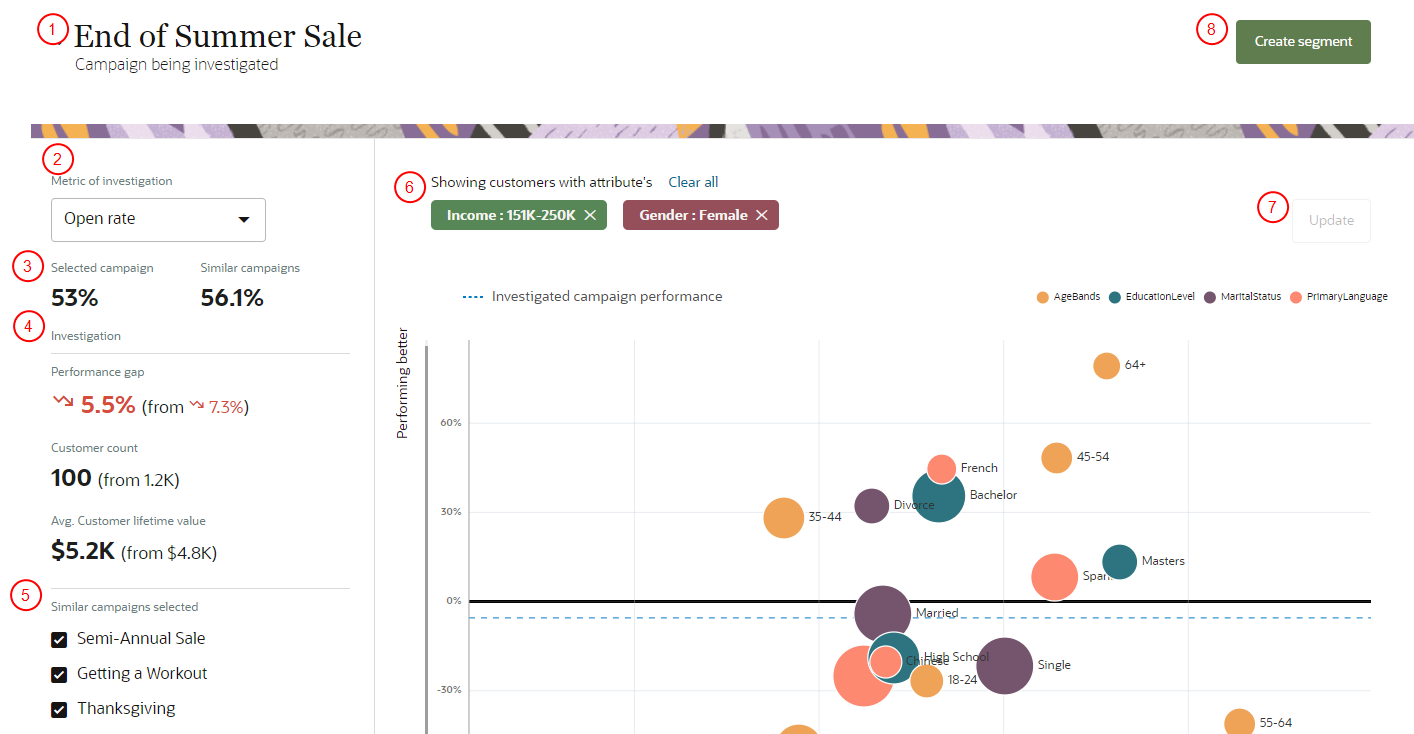
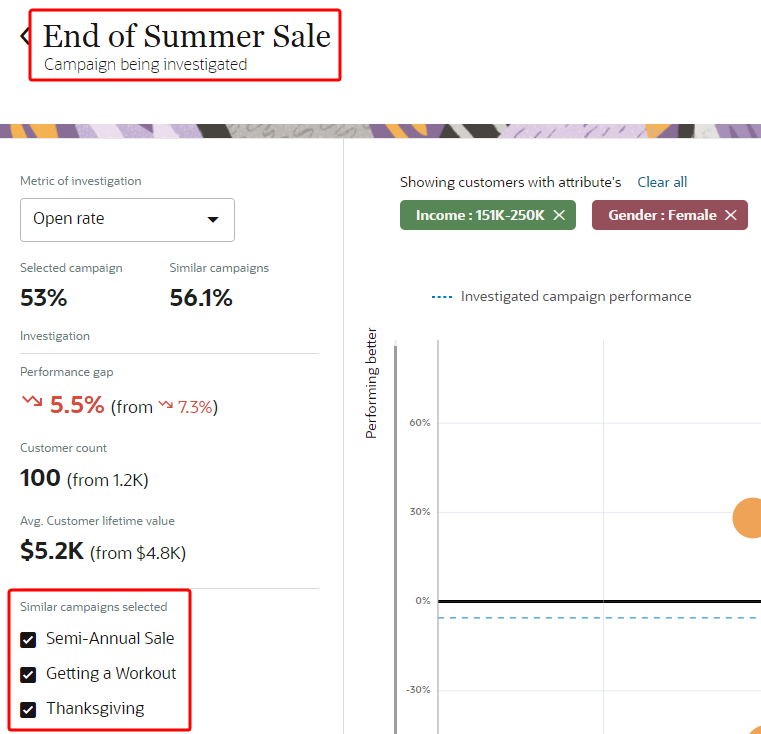
 Campaign being investigated: The name of the campaign you are investigating.
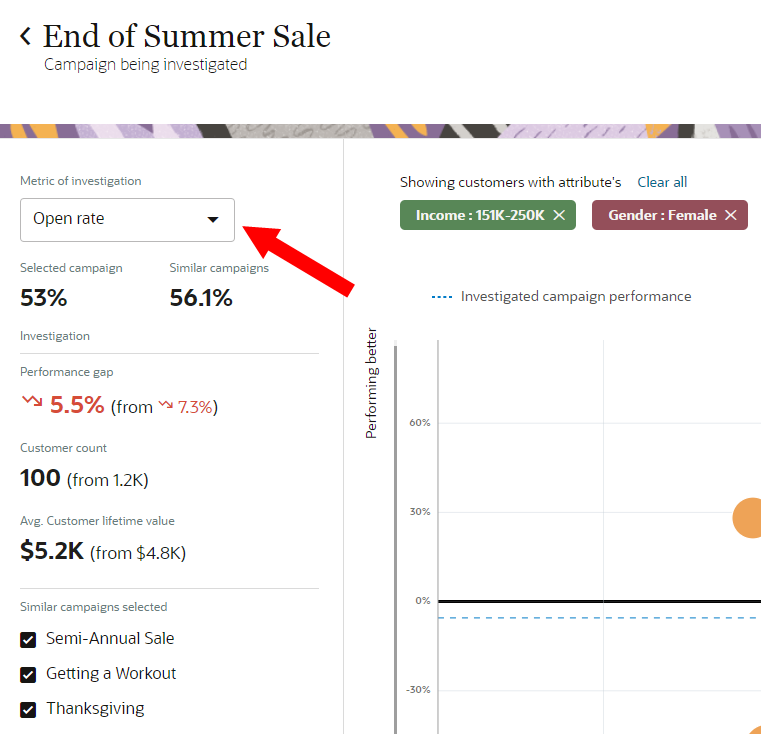
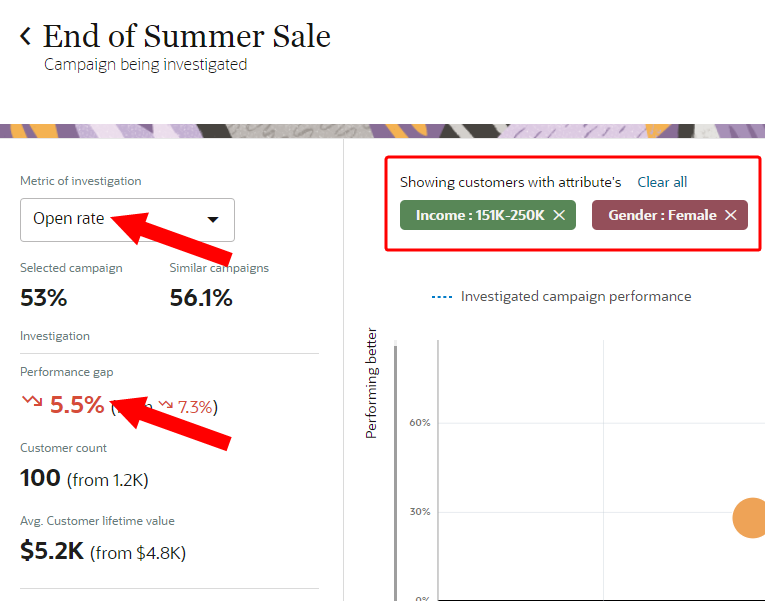
 Metric of investigation: Change the metric you are currently investigating in the comparison matrix.
 Metric value of selected campaign and similar campaigns: Based on the metric selected, the metric value of the selected campaign and the average metric value of the similar campaigns.
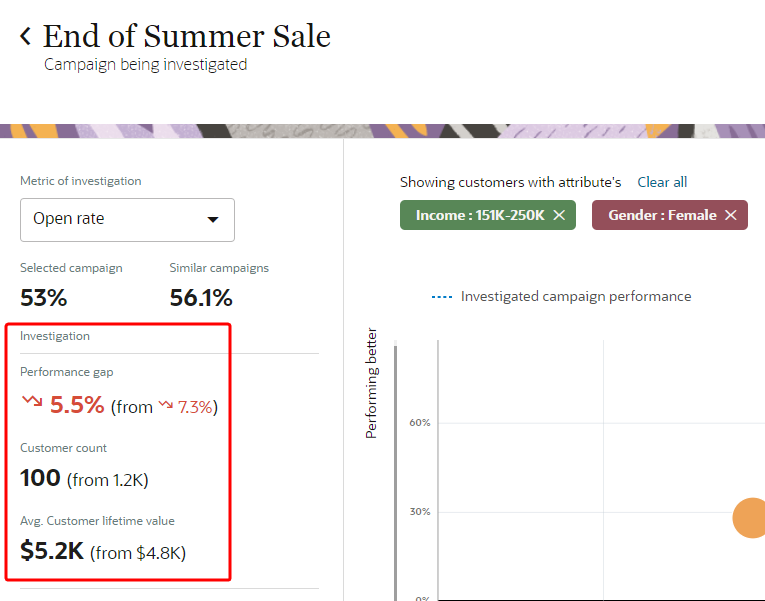
 Investigation values: Values on Performance gap, Customer count, and Customer lifetime value.
- Performance gap: The difference in performance between the campaign being investigated and the average performance of all similar campaigns.
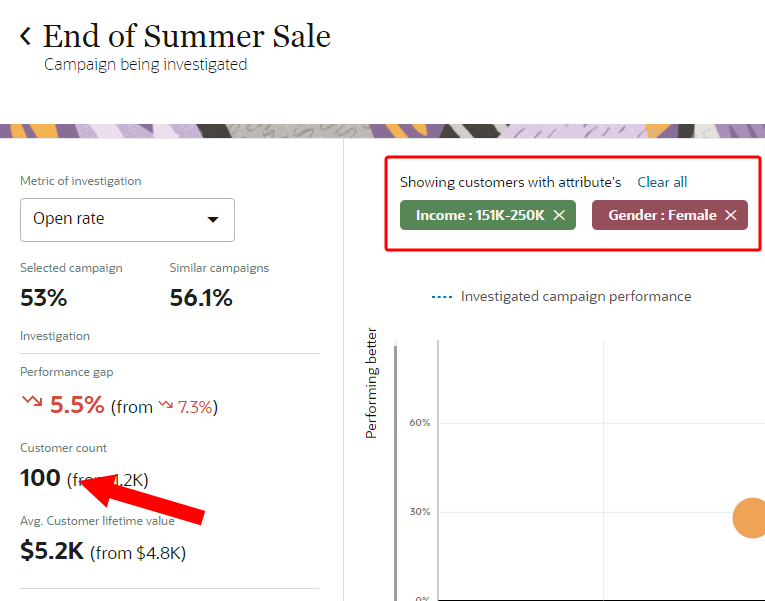
- Customer count: The total amount of customers in the campaign being investigated. As you add filters for analysis, the value displayed will represent the subset of customers in the campaign being investigated that meet the filter criteria.
- Customer lifetime value: The total amount spent by a customer over the course of their lifetime.
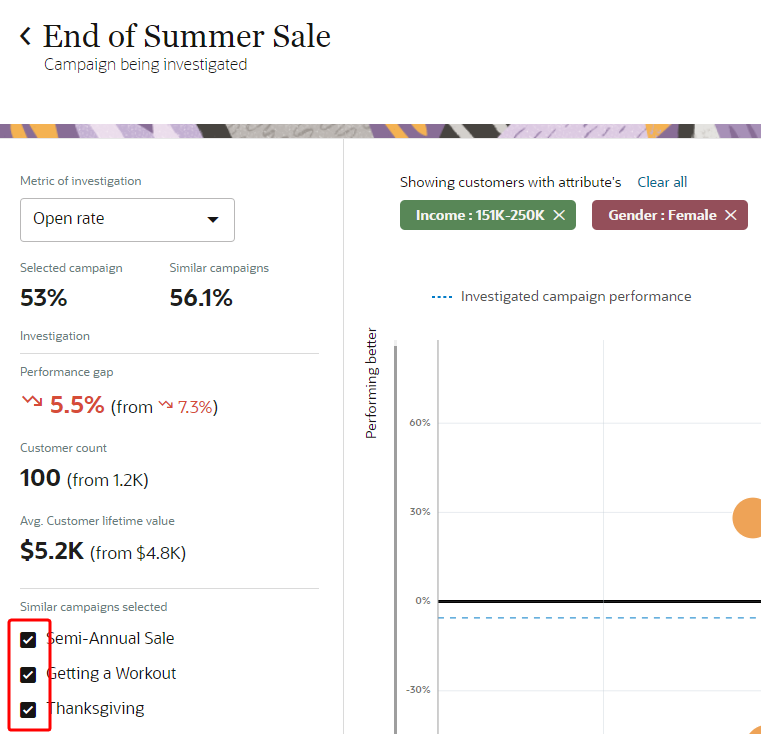
 Similar campaigns selected: The campaign names of the similar campaigns selected for the analysis.
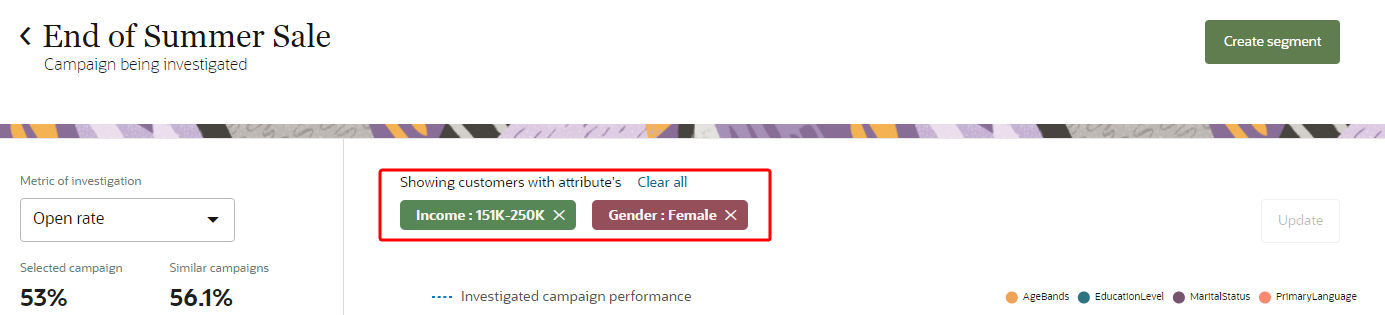
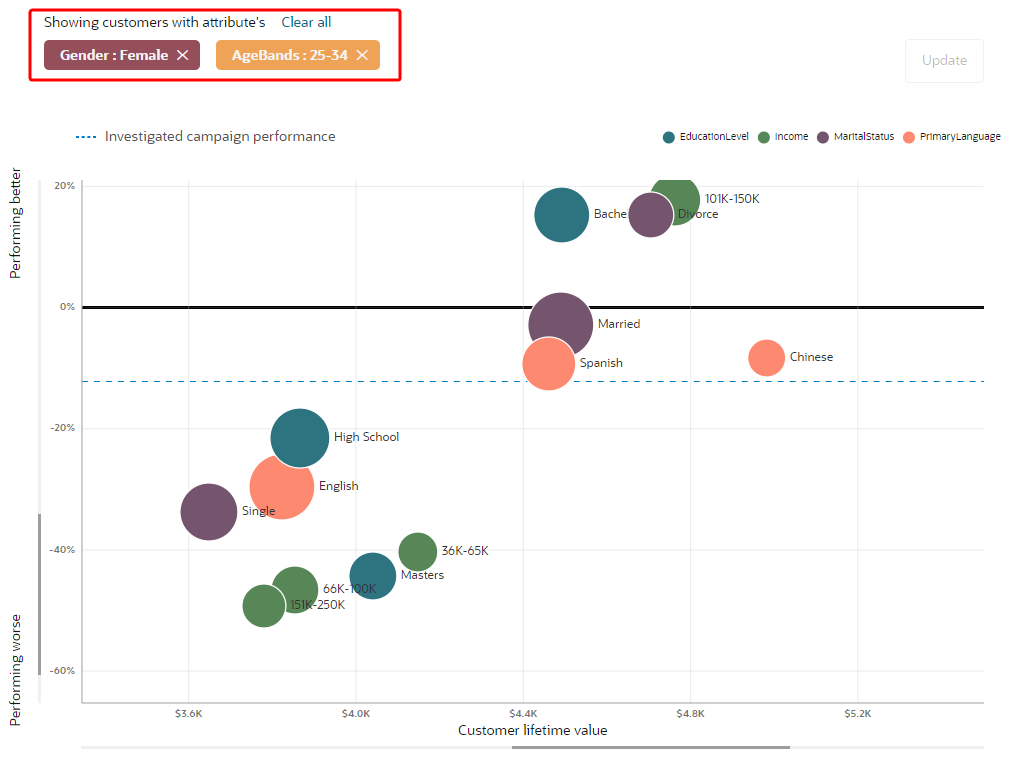
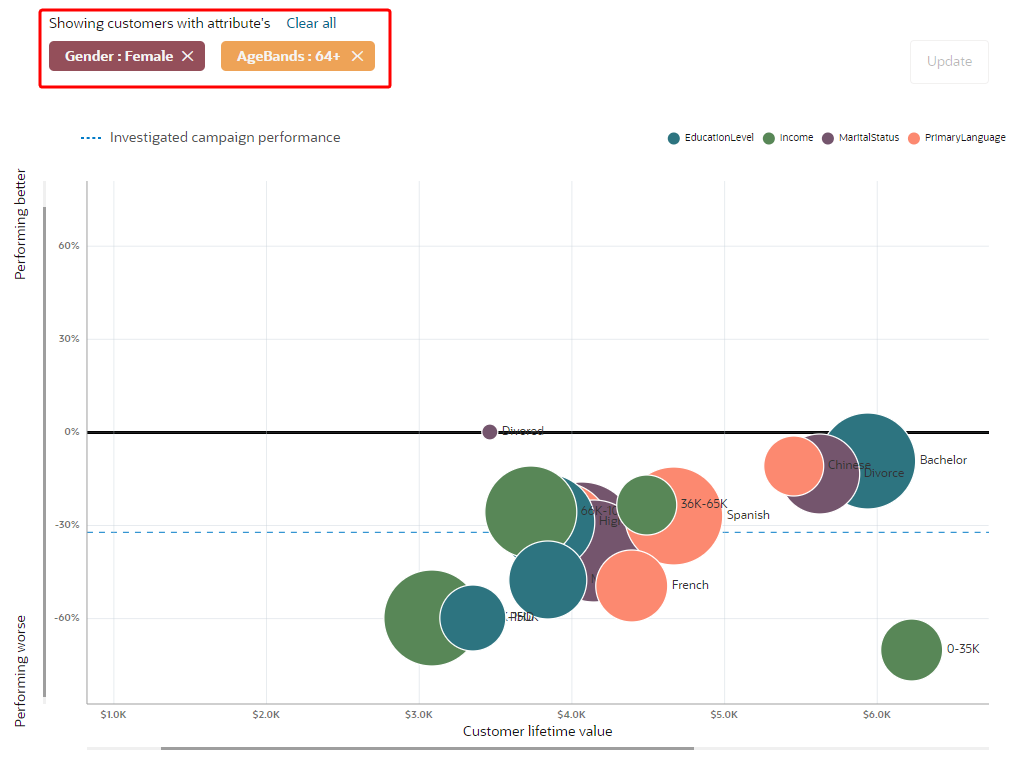
 Showing customers with attribute: The breadcrumb attributes that you have selected as part of the investigation. Clear all will remove all selected attributes.
 Update: Click Update whenever you make changes to the comparison matrix to refresh the data.
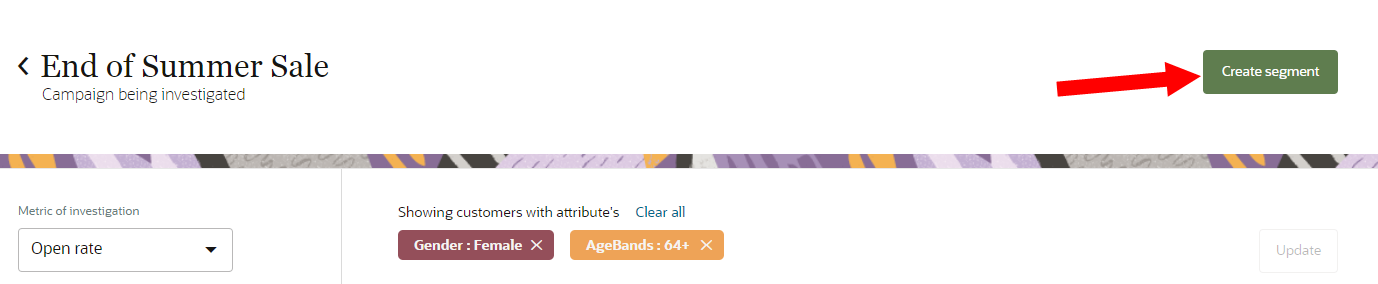
 Create Segment: After finding a group of customers you would like to re-target for a campaign, click Create Segment to open the segmentation canvas with investigation details pre-filled for the construction of a segment for re-targeting. See how to use the comparison matrix and how to create a segment from the comparison matrix. Learn more about Creating segments from the segmentation canvas.
To review and manage the campaign analysis indicators:
- Confirm the name of the campaign you are investigating and the similar campaigns that will be used as a baseline of comparison.
- To remove or re-add a similar campaign from the investigation, click the checkbox for the campaign.
- To change the current metric being investigated, open the drop-down list for Metric of investigation.
- Average order value
- Click rate
- Click to open rate
- Conversion rate
- Open rate
- Review the breadcrumb attributes under Showing customers with attribute. These attributes represent the filters selected at any point in the investigation. The metric values will be updated based on the customer subset created by the filters selected. Click X in the attribute to remove it from the filters or click Clear all to remove all attributes
- Review the Investigation values.
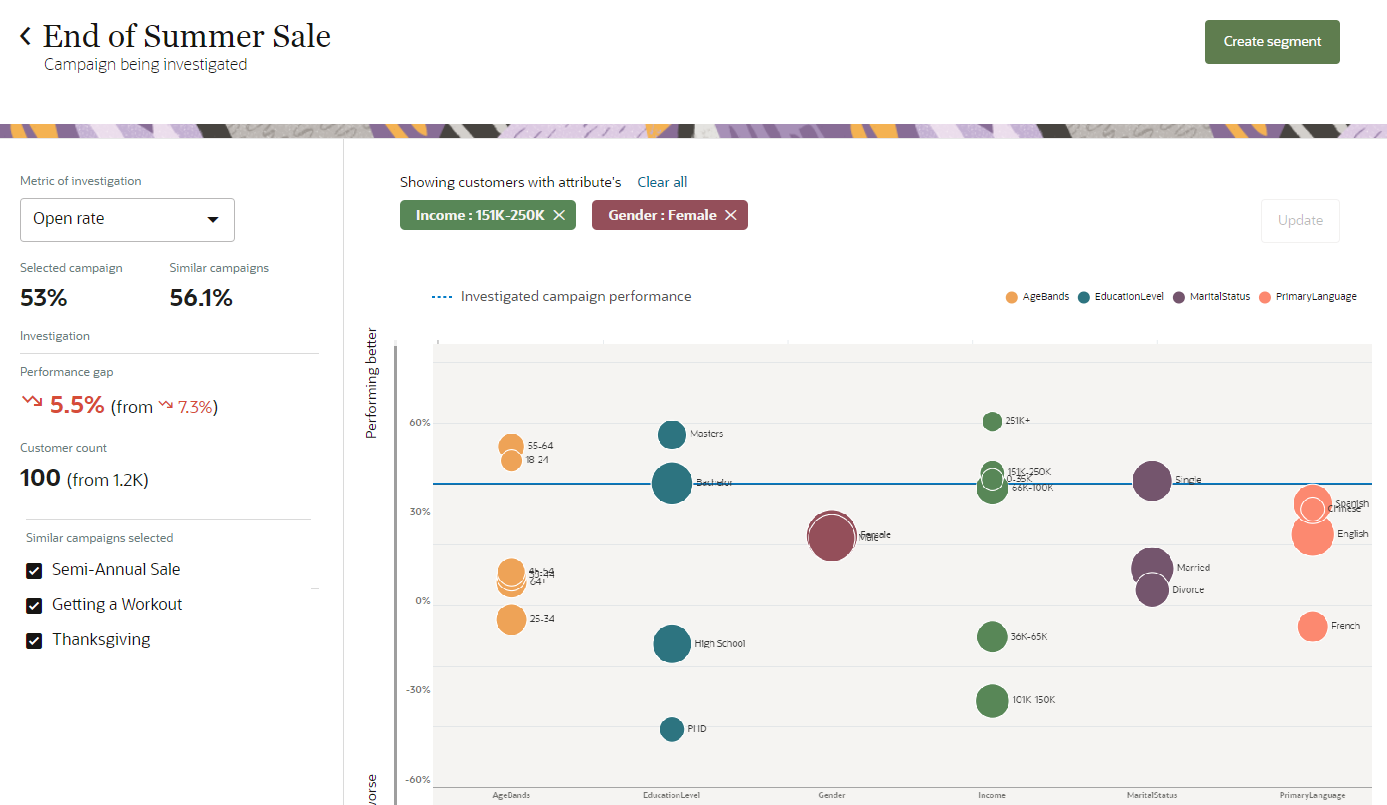
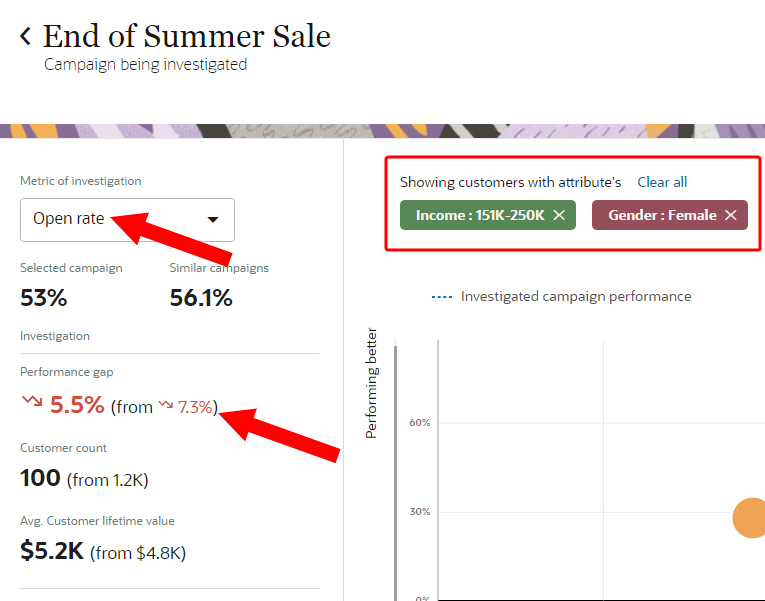
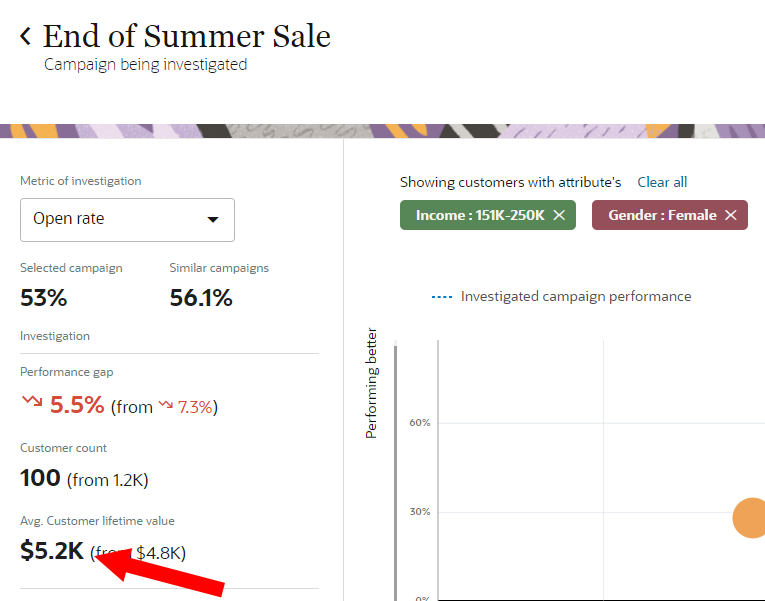
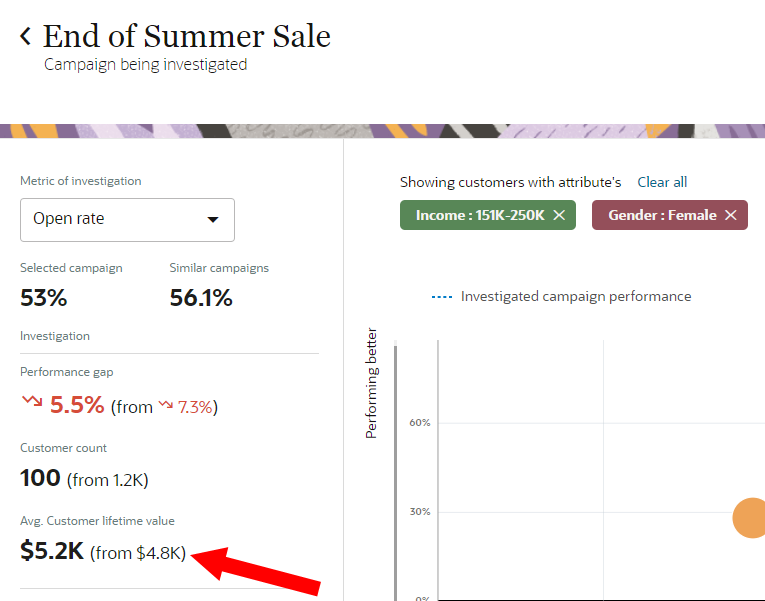
- Based on the metric and attributes selected for analysis, Performance gap displays the difference in performance between the customers in the investigated campaign and the average performance of the customers in the similar campaign. In the example below, female customers with an income between $151k and $250k had an open rate 5.5% lower in the End of Summer Sale compared to the average open rate for the same group of customers in the similar campaigns.
- The value in parentheses displays what the values were at the start of the investigation before any filters were selected. In the example below, female customers with an income between $151k and $250k had an open rate 5.5% lower in the End of Summer Sale compared to the average open rate for the same group of customers in the similar campaigns. Before any filters were selected for investigation, the performance gap was 7.3% lower.
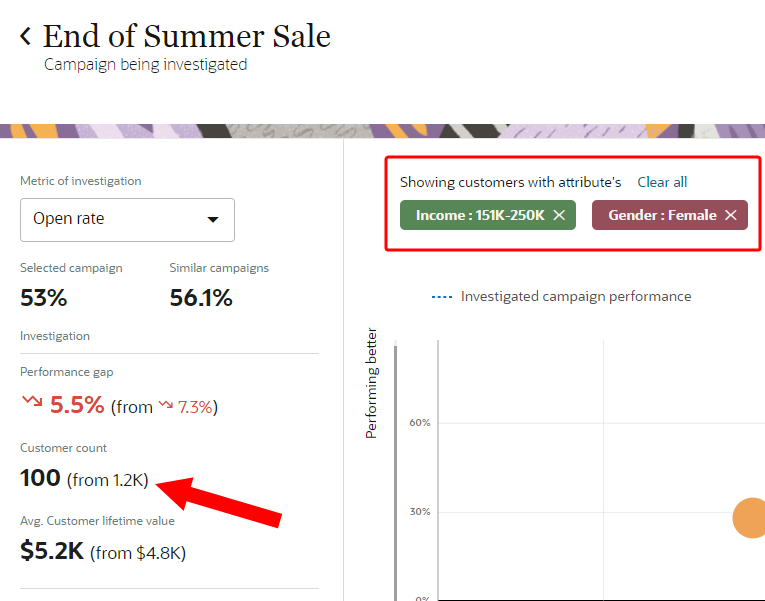
- The number of customers within the selected filters in the campaign being investigated. In the example below, the total number of female customers with an income between $151k and $250k in the End of Summer Sale campaign is 100.
- The value in parentheses displays what the values were at the start of the investigation before any filters were selected. In the example below, the total number of customers in the End of Summer Sale campaign before any filters were selected was 1.2K.
- Based on the attributes selected for analysis, Customer lifetime value displays the customer lifetime value for the selected customers in the investigated campaign. In the example below, female customers with an income between $151k and $250k in the End of Summer Sale have an average customer lifetime value of $5.2K.
- The value in parentheses displays the average customer lifetime value for all customers in the investigated campaign. In the example below, the average customer lifetime value for all customers in the End of Summer Sale is $4.8K.
You can investigate the following metrics:
To see descriptions of metrics, review B2C Dashboard metrics.
The Performance gap displays the following values:
The Customer count displays the following values:
The Customer lifetime value displays the following values:
The comparison matrix
The comparison matrix shows you how different groups of customers in the investigated campaign performed compared to the same groups of customers in the similar campaigns. This comparison is based on the following:
- The metric you select in the Campaign analysis indicators section.
- The attributes of the investigated campaign you select for analysis.
- The attribute values that represent different groups of customers in the investigated campaign.
- The relative placement of attribute values showing if that group of customers in the investigated campaign performed better, worse, or similarly to the same group of customers in the similar campaigns.
The campaign matrix section has the following elements.
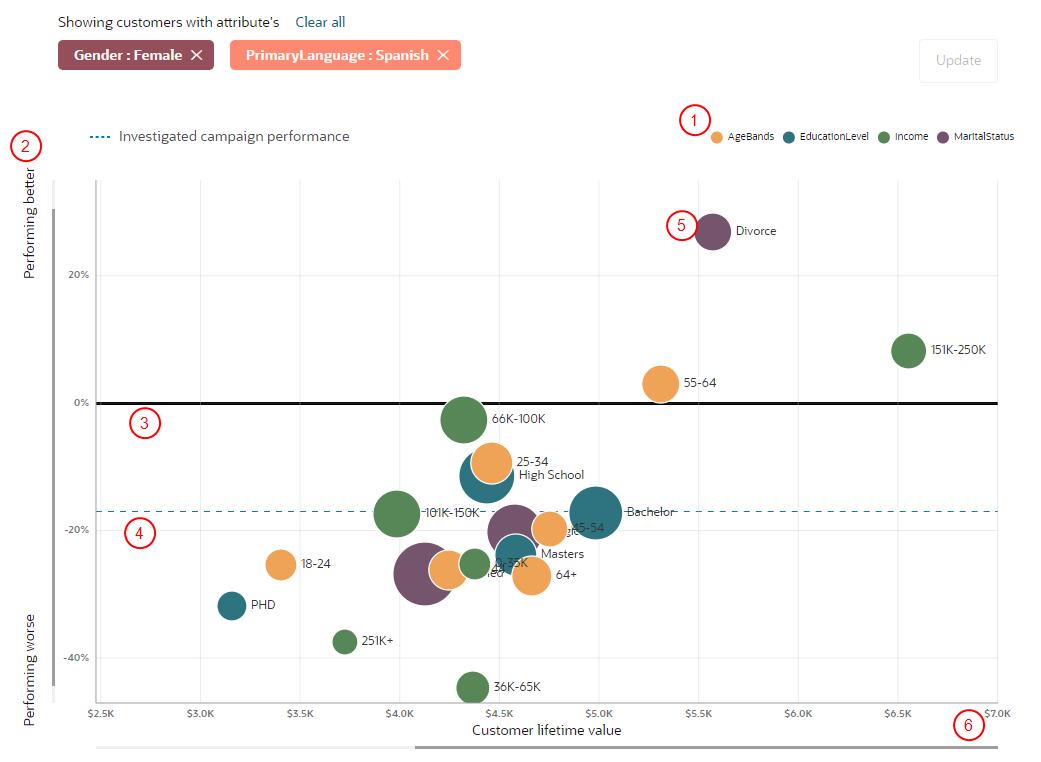
Attribute legend: The attributes you can add to the matrix. Click attributes in the legend to hide and show them in the matrix. You can add up to eight attributes to the matrix.
Y-axis: Displays the difference in performance between the investigated campaign and the similar campaigns.
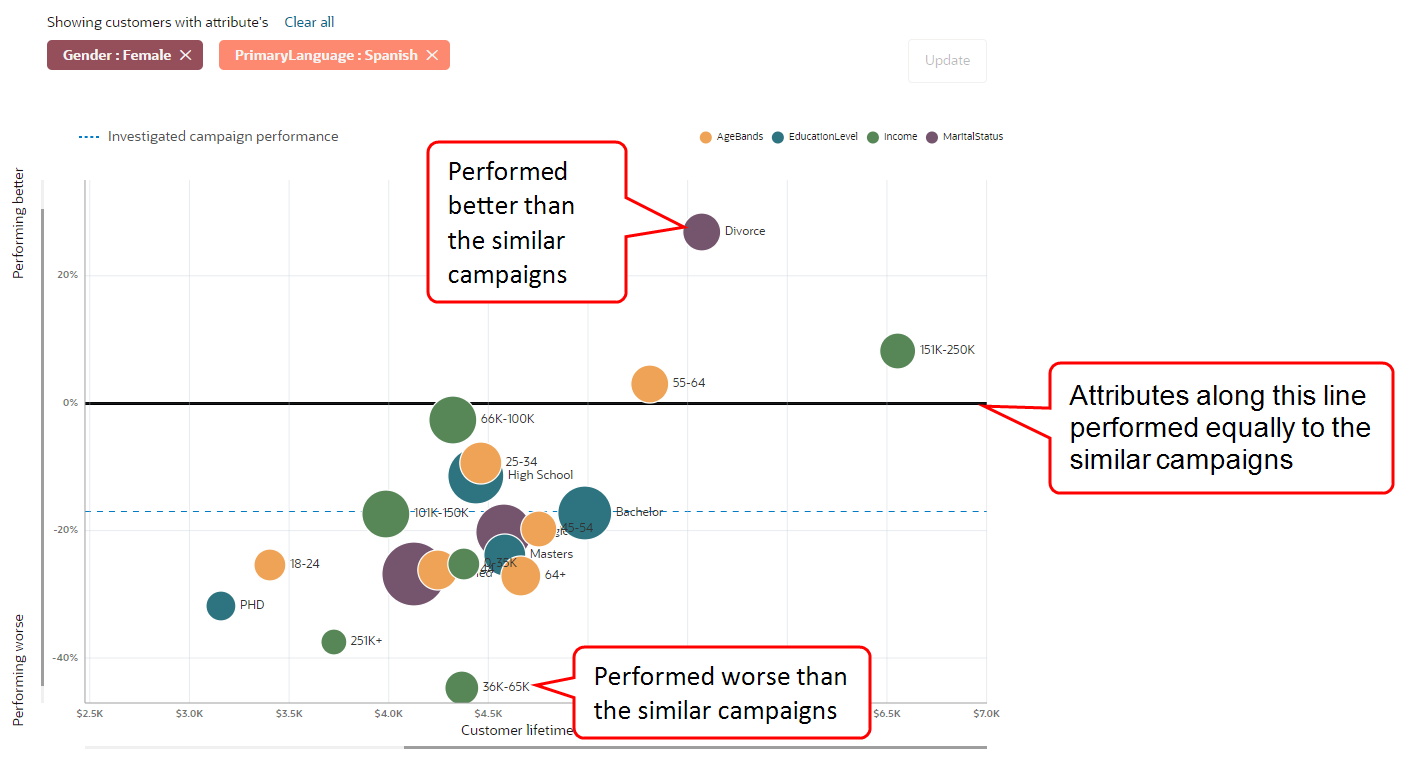
Line of similarity: Groups of customers in the investigated campaign on or near this line performed equally to the same groups of customers in the similar campaigns.
Investigated campaign performance: The line that represents how the investigated campaign performed on average compared to the average performance of the similar campaigns. This line will update based on the filters selected for investigation.
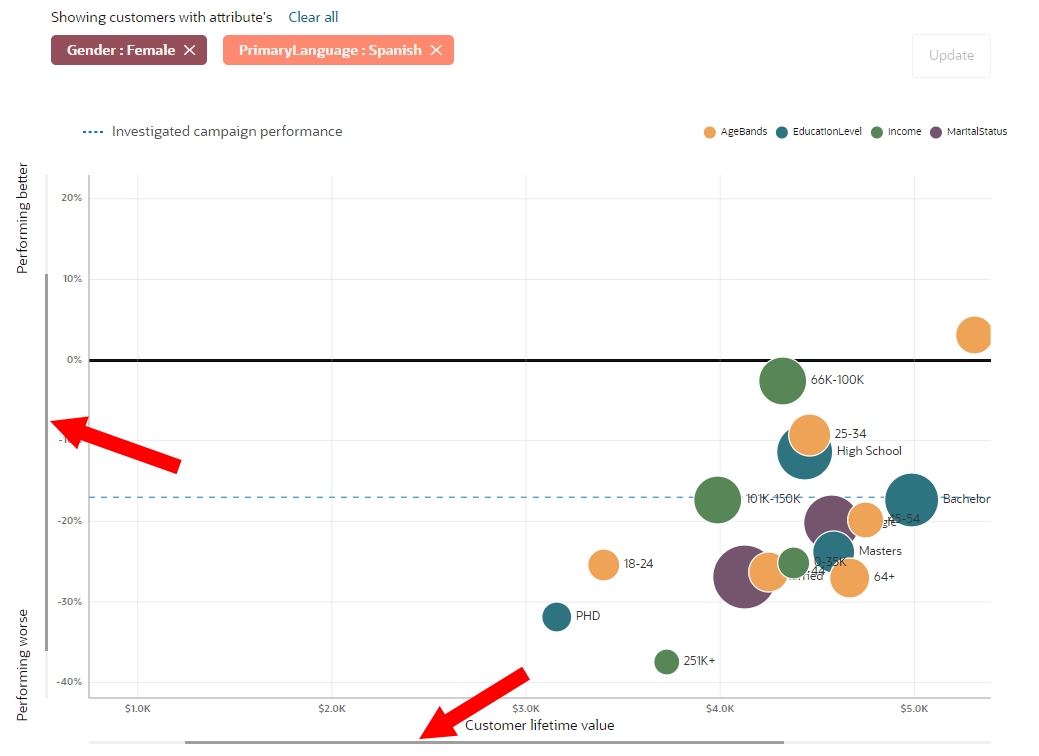
Attribute values: Visual representations of the number of customers targeted in the investigated campaign. Larger circles represent a higher number of customers. The attribute names are listed underneath each group of attribute values. Hover your mouse over attribute values to view more information about them.
Note: The comparison matrix will only show data for each attribute type that has a value. If a customer has a null value for the attribute type then that customer will not be included in the matrix. This may cause a disparity between the total customer count and the combined count of an attribute's individual values. For example, there might be 1,000 customers in the campaign, but the attribute for Age group might add up to 970 customers for all individual age groups. The 30 "missing" customers from this attribute will not appear on the comparison matrix because they have no value.
X-axis: Displays the customer lifetime value, which represents the average lifetime value of the customers within each sub-group.
- Analyze the matrix by comparing the placement of attribute values in relation to the line of similarity. Attributes that are on or near that line represent customers in the investigated campaign that performed similarly to the same customers in the similar campaigns. Attributes that are above the line represent customers that performed better than the same customers in the similar campaigns and attributes below the line performed worse. Also consider the size of the circle and their impact to the total customer count of the investigated campaign. You can then select attribute values you want to investigate further.
- Manipulate the matrix view as needed by doing the following.
- Select multiple attribute values and add them as filters to the comparison matrix. After clicking an attribute value and clicking Update, you will see it listed above the matrix under the heading Showing customers with attribute. To remove the attribute value as a filter, click X.
- Continue investigating attribute values and compare performance until you have identified the optimal group of customers you would like to re-target in a campaign.
Use your mouse wheel to zoom in and out of the matrix. When zoomed in, click and drag the matrix up/down and left/right.
Hover your mouse and click Marquee zoom. Then, drag and draw a rectangle with your mouse to zoom into that specific area of the matrix.
Click and drag the horizontal and vertical scroll bars to move the matrix.
To select multiple attribute values, you can do one of the following.
Hover your mouse and click Marquee select, Then, drag and draw a rectangle around the attribute values you want to select.
Hold the Ctrl button while clicking the attribute values you want to select.
Example: You notice that females in the investigated campaign performed considerably worse than the same groups females in the similar campaigns. After selecting the females filter for analysis, you also notice that females aged 25-34 and 64+ performed considerably worse as well, so you select them for further investigation. This allows you to see how specific group of customers performed in the investigated campaign compared to the similar campaigns.
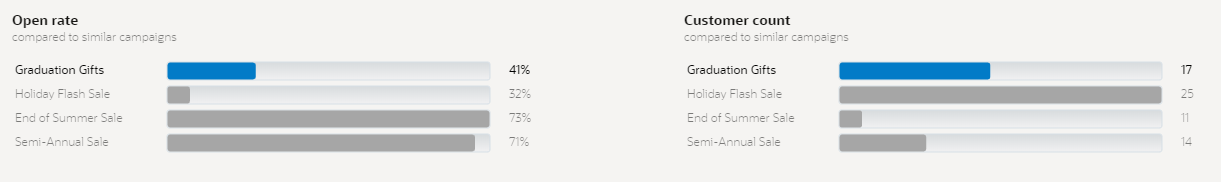
Individual campaign breakdown
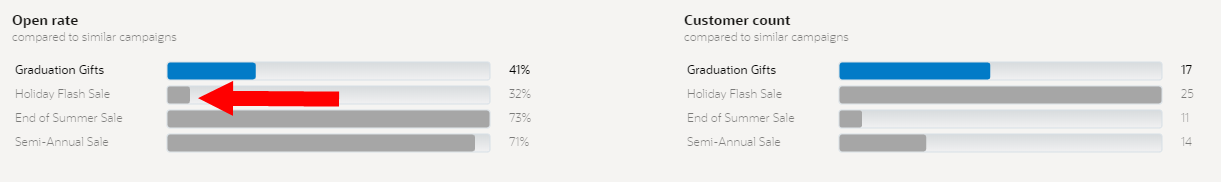
The bottom of the page shows a comparison of the investigated campaign and each individual similar campaign. You can compare the metric you have selected for analysis as well as the size of each campaign.
If a campaign has zero customers, then it will not be displayed in the comparison of the metric or the size of the campaign.
If the metric investigated or customer count of one of the similar campaigns varies greatly compared to the other campaigns, you may want to remove it so that you can get a more valid baseline of comparison. Click Edit selection at the top of the page to remove it from the investigation.
Step 3: Create a segment
After identifying the group of customers that you want to re-target in a campaign, move on the next task below so you can create a pre-filled segment with the conditions needed to target that group of customers. You can configure and save that segment on the segmentation canvas.
To create a segment:
- Click Create segment.
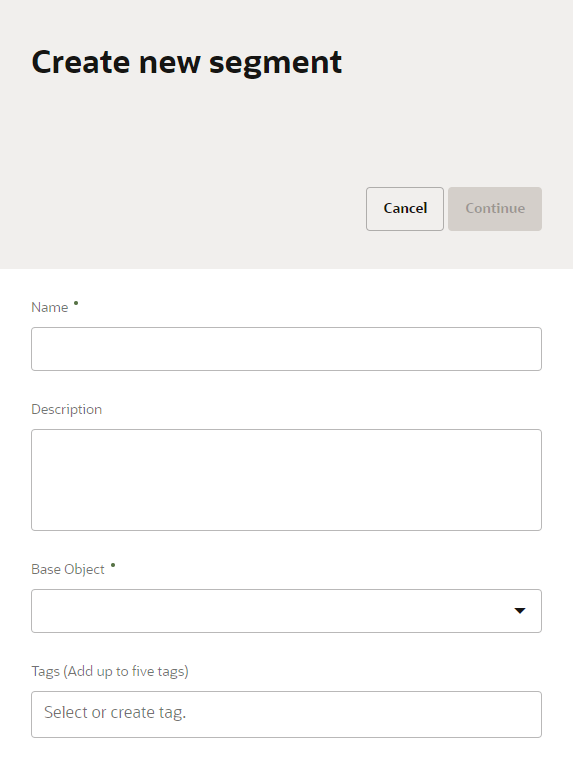
- Enter the details for the segment.
- Name: Enter a unique name. The name must be 1 or more characters, up to a maximum of 128. Other than underscores (_) and hyphens (-), special characters are not allowed. The first character cannot be a space. You can use characters from all languages supported in the language settings.
- Description: Enter a description. This field is optional, but it is highly recommended to add descriptions for any entity created. This helps all other users get additional context when using and navigating Oracle Unity. The description can have a maximum of 512 characters with no restrictions on characters used. You can use characters from all languages supported in the language settings.
- Base Object: Select the base object you are using to create the segment.
 for base objects that shouldn't be available for selection.
- The list of available segments under My segments will only be segments created with the same base object selected.
- You will be able to select Personalization attributes from attributes belonging to the base object selected. Learn more about Attributes available for personalization.
- You can view the base object for a segment on the Segments page under the Base Object column.
- Tags: Enter applicable tags to organize the segment with keywords.
- Tag names must be 30 or fewer characters. Other than underscores (_), special characters are not allowed. The first character must be a letter. You can use characters from all languages supported in the language settings.
- You can add up to five tags to a segment.
- You can search for tags on the Segments page under the Tags filter.
- Click the checkbox to add the segment to your list of favorites.
- Click Continue. A new tab will open on your browser with the segmentation canvas.
- The pre-filled segment will be based on the attributes and metric you selected to investigate and will target the customers that did not perform the action defined in the metric. It will have the following attributes and conditions:
- Campaign ID that matches the ID of the investigated campaign.
- Profile attributes and conditions based on the attributes selected in the investigation. For example, the pre-filled segment may have the attributes Gender and Marital status, the operator Matches for both, and the values Male and Married.
- Behavioral attributes and conditions that target the customers that did not perform the action defined in the metric.
- Open rate: Includes customers that were sent a campaign email but did not open it.
- Click rate: Includes customers that were sent a campaign email but did not click the link in the email.
- Click to open rate: Includes customers that opened campaign email but did not click the link in the email.
- Conversion rate: Includes the following customers.
- They didn't purchase an item from the campaign email.
- They purchased an item from the campaign email but they canceled or returned it.
- Average order value: Selecting this metric will not create any additional behavioral conditions for the pre-filled segment.
- If needed, configure the conditions with additional criteria. Learn more about Creating segments.
- When done, click Save.
- Return to the browser tab that has the Campaign analysis page, click Clear all to removed all the breadcrumb attributes selected, and work on identifying additional groups of customers you would like to re-target. Then, click Create segment.
- When you have completed the campaign investigation, click the arrow button under the name of the campaign being investigated. You will return to the One time campaigns page.
The Create new segment dialog displays.
Review and confirm the pre-filled conditions.
You can manage segments you have created from the Manage segments page. Learn more about Managing segments.
After creating the segment, you can export it so that you can re-target the customers in a new campaign. Learn more about creating Creating export jobs and Creating segment deliveries.
Managing B2C dashboard widgets