Custom Report Prompts
Note: Custom reports are supported for the Email, SMS, Mobile App (for Push notifications, In-app messages, and messages sent to Message Center), and Web Push channels. Learn more about the prerequisites to creating custom reports. Additionally, when creating custom reports, keep in mind these important considerations for Mobile App custom reports and for Message Center dimensions.
Dashboards provide the ability to create custom reports (also called analysis). Prompts are drop-down fields that allow report users to dynamically filter the results of a report.
You can select one of three types of prompts, which can comprise multiple views, for example a table and a graph:
- Table prompt—Applies to a table.
- Graph prompt—Applies to a graph.
- Report prompt—Applies to both tables and graphs. The report prompt applies before any table or graph prompts.
To add a report prompt:
- Navigate to Interactive Dashboards
- Open a custom report by creating a new one, or editing one from the Catalog.
- Select the Prompts tab.
- Click
 and select Column Prompt.
 - Do one of the following:
- To create a prompt using a column in the report, select the column you want.
- To create a prompt using a column that is not included in the report, click More Columns…, select a column in any folder, then click OK.
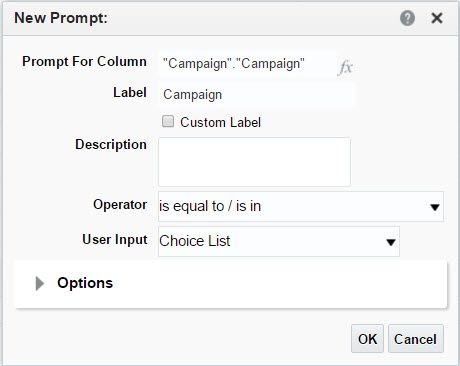
The New Prompt dialog opens.
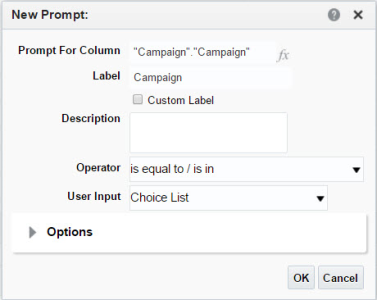
- Optionally, select any other options you need.
- Click OK.
- Repeat steps 1-5 to add more report prompts as needed.
Note: Report prompts are always placed on a separate page from the report (labeled Page 1). You cannot change this placement. To change the settings for the prompt page, such as title and prompt location, click
 next to Page 1.
Tip: To see how the report appears to users, select the Results tab and click
 .
.
To add a table or graph prompt:
- Navigate to Interactive Dashboards.
- Open a custom report by creating a new one, or editing one from the Catalog.
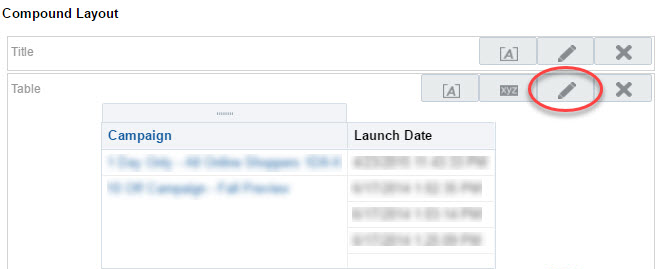
- Select the Results tab and click
 of the table or graph.
- Drag measures and/or columns from Subject Area to Table Prompts or Graph Prompts.
- Click Done.