Campaign Comparison Across Intervals Dashboard
Note: This dashboard is available only to users with the Email Analytics Manager role.
This dashboard helps you compare performance of specific campaigns by the number of days (or intervals) after they were sent. For example, you can compare performance of a Thanksgiving campaign you sent this year on day 2 versus a similar campaign you sent last year.
This dashboard includes the following chart:
To open the Campaign Comparison Across Intervals dashboard:
- Click
 Insight on the side navigation bar, and select Interactive Dashboards.
 - Click Dashboards > Analytics.
- On the Analytics page, select the Email tab and expand Performance.
- Select Interval Analysis.
- Click
 View More Reports, and select Campaign Comparison Across Intervals.
Dimensions
A dimension is a data attribute used to categorize or filter a measure. A measure by itself has no meaning if presented without the context of a dimension.
Important: If you change a campaign’s name, folder, marketing program, marketing strategy, subject line, or external campaign ID, then historical and new launches for both triggered and standard launches will take these new values in Insight. It does not impact CED behavior as CED retains an unchanged ‘snapshot’ of values.
| Dimension | Definition |
|---|---|
| Interval | Used to group performance measures by a time period based on the number of days since launched |
| Campaign | Name of the campaign |
Measures
A measure is a numerical measurement representing the calculations gathered from your Oracle Responsys account and applied to your reports.
| Measure | Definition |
|---|---|
| Click-Through Rate | (Total Clicks / Delivered) * 100% Unsubscribes do not register as Clicks and therefore do not contribute to the calculation of Click-Through Rate, which is why a campaign's Click-Through Rate may be different from its Unsubscribe Rate. |
| Open Rate | (Opens / Delivered) * 100% |
| Unique Open Rate | (Unique Opens / Delivered) * 100% |
| Unique Click-Through Rate | (Unique Clicks / Delivered) * 100% |
| Conversion Rate | (Conversions / Delivered) * 100% |
| Unsubscribe Rate | (Unsubscribes / Delivered) * 100% Unsubscribes do not register as Clicks and therefore do not contribute to the calculation of Click-Through Rate, which is why a campaign's Click-Through Rate may be different from its Unsubscribe Rate. Learn more about setting up the default unsubscribe action for campaigns. |
| Spam Complaints Rate | (Total Spam Complaints / Delivered) * 100% |
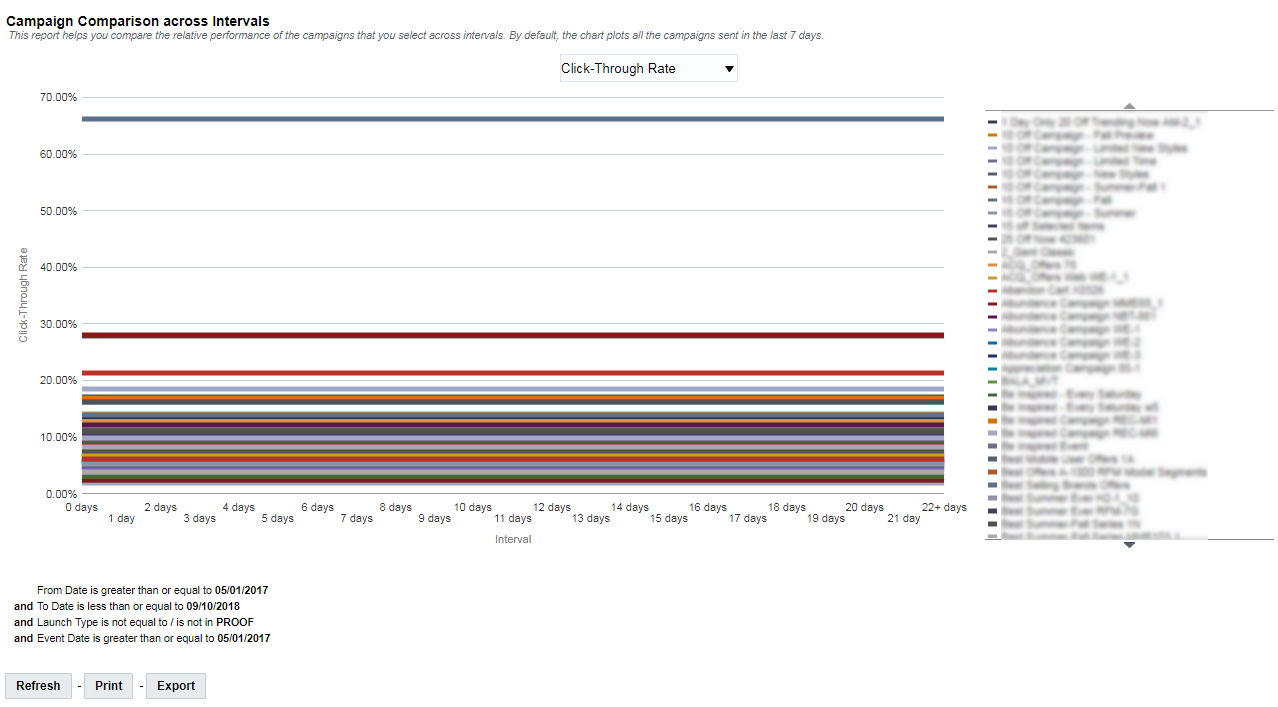
Campaign Comparison Across Intervals Chart
This chart helps you compare relative performance of the selected campaigns across intervals. By default, the chart plots all the campaigns sent in the last 7 days. Use the drop-down menu to switch between measures: Click-Through Rate, Open Rate, Unique Open Rate, Unique Click-Through Rate, Conversion Rate, Unsubscribe Rate, and Spam Complaints Rate.