Interval Analysis Dashboard
Note: This dashboard is available only to users with the Email Analytics Manager role.
This dashboard helps compare the performance of campaigns by pre-determined day intervals after they are sent. This comparison is particularly useful when comparing the performance of several campaigns that were sent on different days but had a similar goal. For example, compare the performance of a Thanksgiving promotion campaign 1 day after it was sent in 2015 versus 1 day after it was sent in 2016. The dashboard also provides a tabular view of campaign performance by the selected interval.
This dashboard includes the following charts and table:
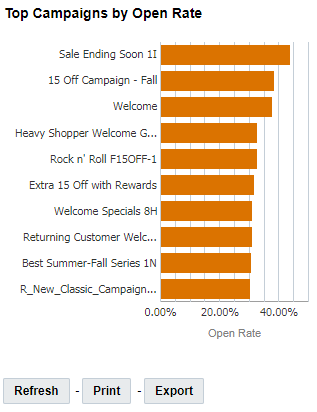
- Top Campaigns by Open Rate Chart
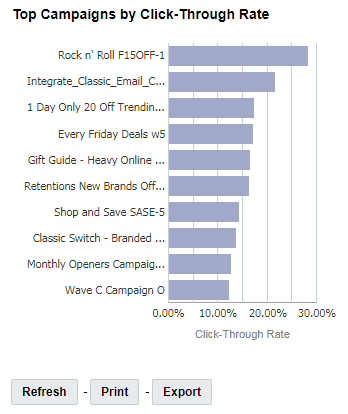
- Top Campaigns by Click-Through Rate Chart
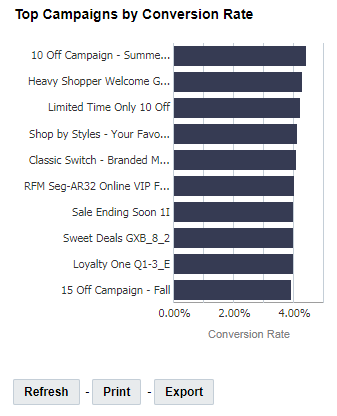
- Top Campaigns by Conversion Rate Chart
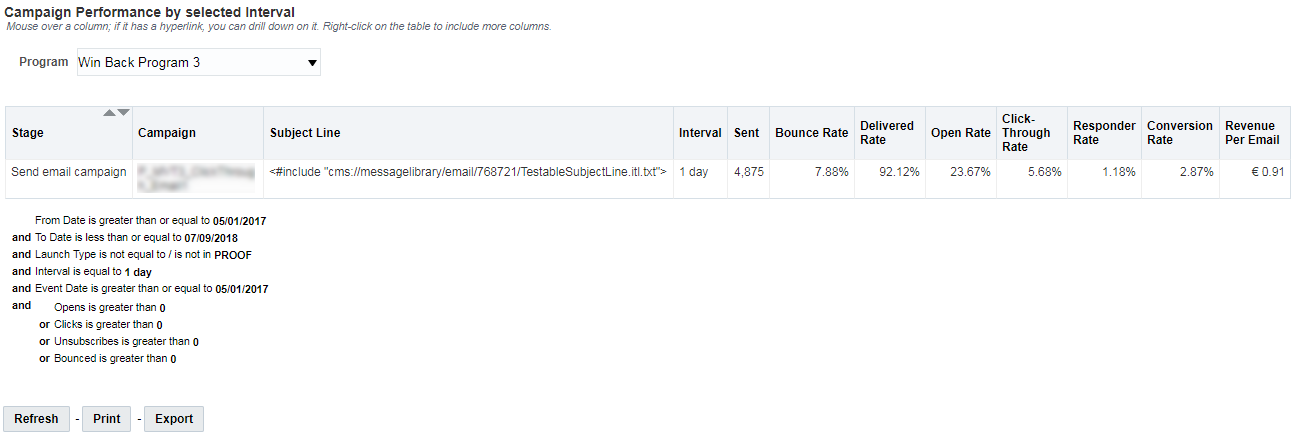
- Campaign Performance by Selected Interval Table
To open the Interval Analysis dashboard:
- Click
 Insight on the side navigation bar, and select Interactive Dashboards.
 - Click Dashboards > Analytics.
- On the Analytics page, select the Email tab and expand Performance.
- Click Interval Analysis.
To see more reports:
- Click
 View More Reports to open the:
To select an interval for comparison:
- Select the number of days from the Interval list.
Dimensions
A dimension is a data attribute used to categorize or filter a measure. A measure by itself has no meaning if presented without the context of a dimension.
Important: If you change a campaign’s name, folder, marketing program, marketing strategy, subject line, or external campaign ID, then historical and new launches for both triggered and standard launches will take these new values in Insight. It does not impact CED behavior as CED retains an unchanged ‘snapshot’ of values.
Measures
A measure is a numerical measurement representing the calculations gathered from your Oracle Responsys account and applied to your reports.
| Measure | Definition |
|---|---|
| Open Rate | (Opens / Delivered) * 100% |
| Click-Through Rate | (Total Clicks / Delivered) * 100% Unsubscribes do not register as Clicks and therefore do not contribute to the calculation of Click-Through Rate, which is why a campaign's Click-Through Rate may be different from its Unsubscribe Rate. |
| Conversion Rate | (Conversions / Delivered) * 100% |
| Sent | Number of sent messages. |
| Bounce Rate | (Bounced / Sent) * 100% |
| Delivered Rate | (Delivered / Total Emails Sent) * 100% |
| Responder Rate | (Responders / Delivered) * 100% |
| Conversion Rate | (Conversions / Delivered) * 100% |
| Revenue Per Email | (Total Revenue / Total Delivered) |
Top Campaigns by Open Rate Chart
Shows performance of campaigns by Open Rate.
Top Campaigns by Click-Through Rate Chart
Shows performance of campaigns by Click-Through Rate.
Top Campaigns by Conversion Rate Chart
Shows performance of campaigns by Conversion Rate.
Campaign Performance by Selected Interval Table
Provides a tabular view of campaign performance by the selected interval. You can drill down on Program and Campaign for a more detailed analysis.