Segment Group Performance Dashboard
Note: This dashboard is available only to users with the Email Analytics Manager role.
The Segment Group dashboard provides a summary of the top-performing rules for a particular segment group and trends the performance over time.
Segment groups are defined on a profile list and are associated with a campaign. You can use segment groups to segment the profile list via rules. For more information about segment groups, see Understanding List Segmentations.
The performance metrics available from this dashboard include:
- Open Rate
- Click-Through Rate
- Conversion Rate
- Revenue per 1K emails
This dashboard includes the following charts and table:
- Segment Group - Rule Performance Chart
- Segment Group Rule Performance Trend Chart
- Segment Group Performance Table
To open the Segment Performance dashboard:
- Click
 Insight on the side navigation bar, and select Interactive Dashboards.
 - Click Dashboards > Analytics.
- On the Analytics page, select the Email tab and expand Performance.
- Click Segment Group.
Dimensions
A dimension is a data attribute used to categorize or filter a measure. A measure by itself has no meaning if presented without the context of a dimension.
Important: If you change a campaign’s name, folder, marketing program, marketing strategy, subject line, or external campaign ID, then historical and new launches for both triggered and standard launches will take these new values in Insight. It does not impact CED behavior as CED retains an unchanged ‘snapshot’ of values.
| Dimension | Definition |
|---|---|
| Segment Group | Segments of a profile list that share common characteristics |
| Segment Rule | Rules that are used to classify the groups |
| Sent Date | Day corresponding to the sent date |
| Campaign | Name of the campaign |
| Program | Name of the program |
| Subject Line | Subject line of the email message |
Measures
A measure is a numerical measurement representing the calculations gathered from your Oracle Responsys account and applied to your reports.
| Measure | Definition |
|---|---|
| Click-Through Rate | (Total Clicks / Delivered) * 100% Unsubscribes do not register as Clicks and therefore do not contribute to the calculation of Click-Through Rate, which is why a campaign's Click-Through Rate may be different from its Unsubscribe Rate. |
| Open Rate | (Opens / Delivered) * 100% |
| Conversion Rate | (Conversions / Delivered) * 100% |
| Revenue Per 1K Email | (Total Revenue / Total Delivered) * 1000 |
| Sent | Number of sent messages. |
| Bounce Rate | (Bounced / Sent) * 100% |
| Delivered Rate | (Delivered / Total Emails Sent) * 100% |
| Unique Open Rate | (Unique Opens / Delivered) * 100% |
| Unique Click-Through Rate | (Unique Clicks / Delivered) * 100% |
| Responder Rate | (Responders / Delivered) * 100% |
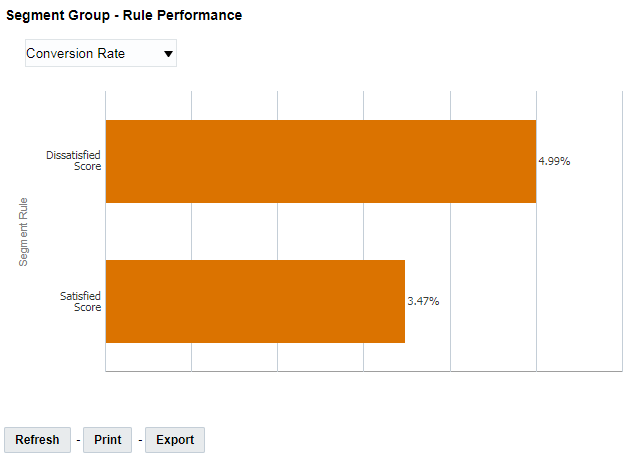
Segment Group - Rule Performance Chart
Shows the top-performing rules for a segment group. Use the drop-down menu to switch between measures: Click-Through Rate, Open Rate, Conversion Rate, or Revenue Per 1K Email.
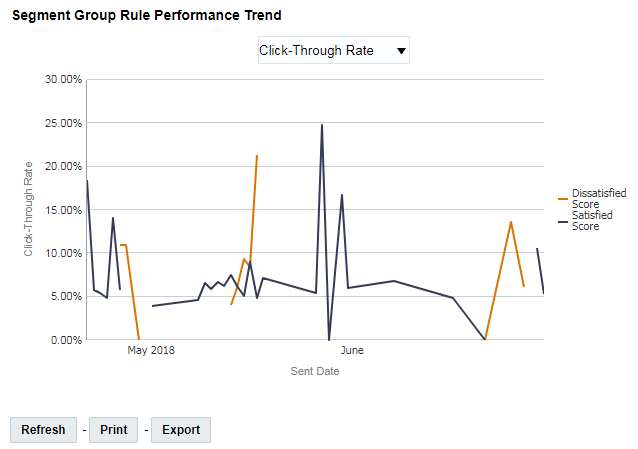
Segment Group Rule Performance Trend Chart
Shows trends the performance of the rules for a segment group over time. Use the drop-down menu to switch between measures: Click-Through Rate, Open Rate, Conversion Rate, or Revenue Per 1K Email.
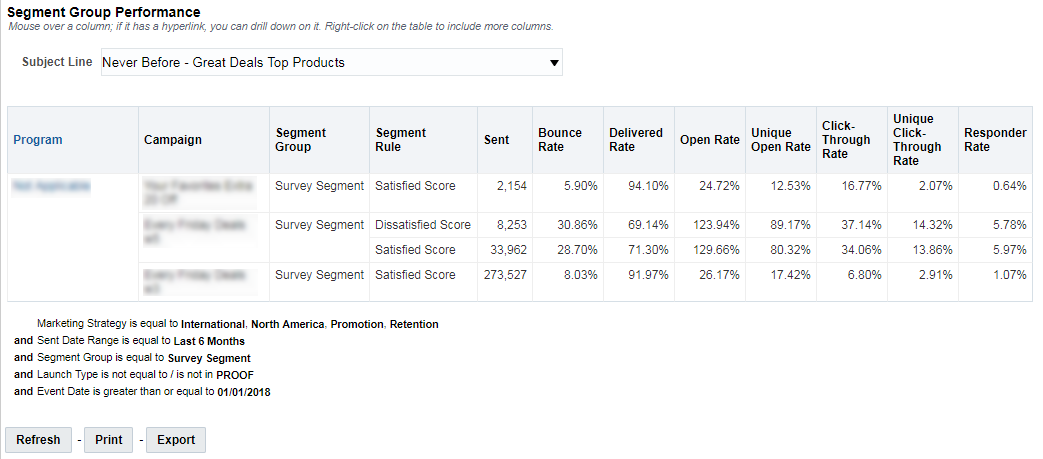
Segment Group Performance Table
Provides tabular view of the segment group performance. You can drill down on Program and Campaign for a more detailed analysis.
- Dashboards Overview
- Using the Dashboards
- Measures for Email - Definitions
- Dimensions for Email - Definitions
- Custom Reports in Dashboards
- Emailing an Analysis from Interactive Dashboards