Quarterly Deliverability Dashboard
Note: This dashboard is available only to users with the Email Analytics Manager role.
This dashboard provides a comprehensive view of a quarter's deliverability health. Learn more about analyzing deliverability in the Email Message Designer.
This dashboard includes the following charts:
To open the Quarterly Deliverability dashboard:
- Click
 Insight on the side navigation bar, and select Interactive Dashboards.
 - On the Analytics page, select the Email tab and expand Deliverability.
- Click Deliverability Trends.
- Click
 View More Reports, and select Quarterly Deliverability Dashboard.
Dimensions
A dimension is a data attribute used to categorize or filter a measure. A measure by itself has no meaning if presented without the context of a dimension.
| Dimension | Definition |
|---|---|
| Sent Month | Month corresponding to the sent date |
| Sent Date | Day corresponding to the sent date |
Measures
A measure is a numerical measurement representing the calculations gathered from your Oracle Responsys account and applied to your reports.
| Measure | Definition |
|---|---|
| Sent | Number of sent messages. |
| Bounce Rate | (Bounced / Sent) * 100% |
| Hard Bounce Rate | (Hard Bounces / Sent) * 100% |
| Soft Bounce Rate | (Soft Bounces / Sent) * 100% |
| Spam Complaints Rate | (Total Spam Complaints / Delivered) * 100% |
| Unique Open Rate | (Unique Opens / Delivered) * 100% |
| Unique Click-Through Rate | (Unique Clicks / Delivered) * 100% |
Summary of Key Performance Metrics
This section of the dashboard provides an overview of the following key performance metrics for deliverability by quarter:
- Sent: Number of sent messages.
- Bounce Rate: (Bounced / Sent) * 100%
- Hard Bounce Rate: (Hard Bounces / Sent) * 100%
- Soft Bounce Rate: (Soft Bounces / Sent) * 100%
- Spam Complaints Rate:
- Unique Open Rate: (Unique Opens / Delivered) * 100%
- Unique Click-Through Rate: (Unique Clicks / Delivered) * 100%
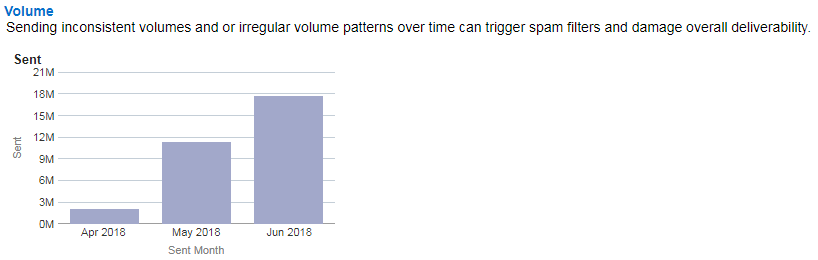
Volume Chart
Shows the number of messages sent in the quarter, broken down by month.
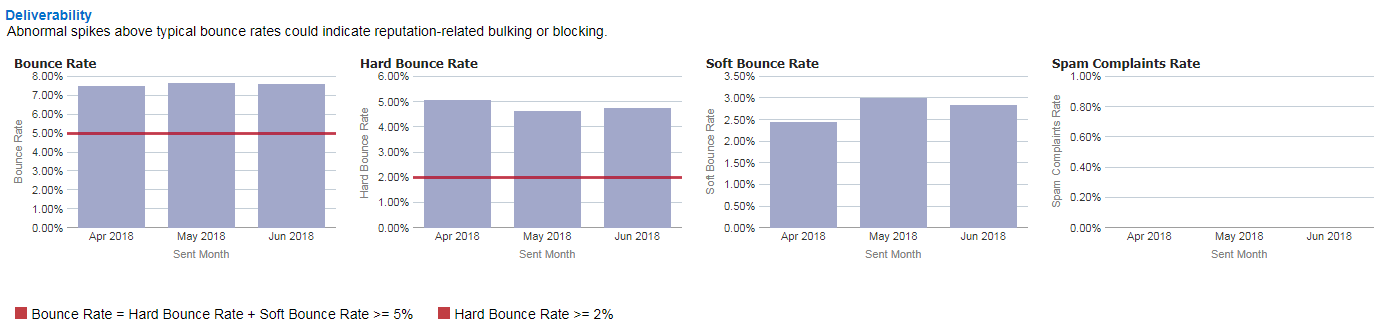
Deliverability Charts
Shows the bounce, hard bounce, soft bounce, and spam complaint rates, broken down by month.
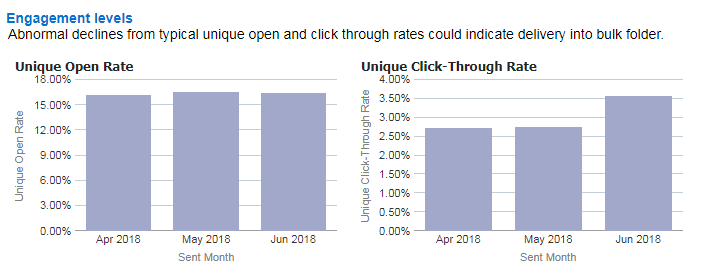
Engagement Levels Charts
Shows the unique open and unique click-through rates, broken down by month.