Dataset Builder
The Dataset Builder appears after you select a root record type for a new dataset, or when you click the dataset name in the Dataset Panel of a workbook. On this tab, you combine record types, fields, and criteria filters to create queries. The results of these queries are the basis for all workbook visualizations in your account.
In the Dataset Builder, your query results are displayed in a table in the Data Grid on the right. Record types, fields, custom formula fields, and configuration options appear in the Records and Fields lists on the left. Only fields in the Data Grid can be used to build workbook visualizations such as pivot tables and charts.
Above the Data Grid, the Criteria Builder lets you create criteria filters to narrow down the results in the grid. Criteria filters affect both your dataset query results and the data shown in workbook visualizations based on the dataset.
To build your dataset, drag fields from the Fields list to the Data Grid. To create a filter condition, drag fields from the Fields list or the Data Grid to the Criteria Builder. In the grid, you can sort and filter the values. After you create your query, you can apply or preview the results in a workbook in several ways.
-
For information about how to use the Dataset Builder to create a query, see Defining a Dataset.
-
For information about creating criteria filters to refine your query results, see Dataset Criteria Filters.
-
For information about creating a workbook based on your dataset query results, see Creating a Workbook.
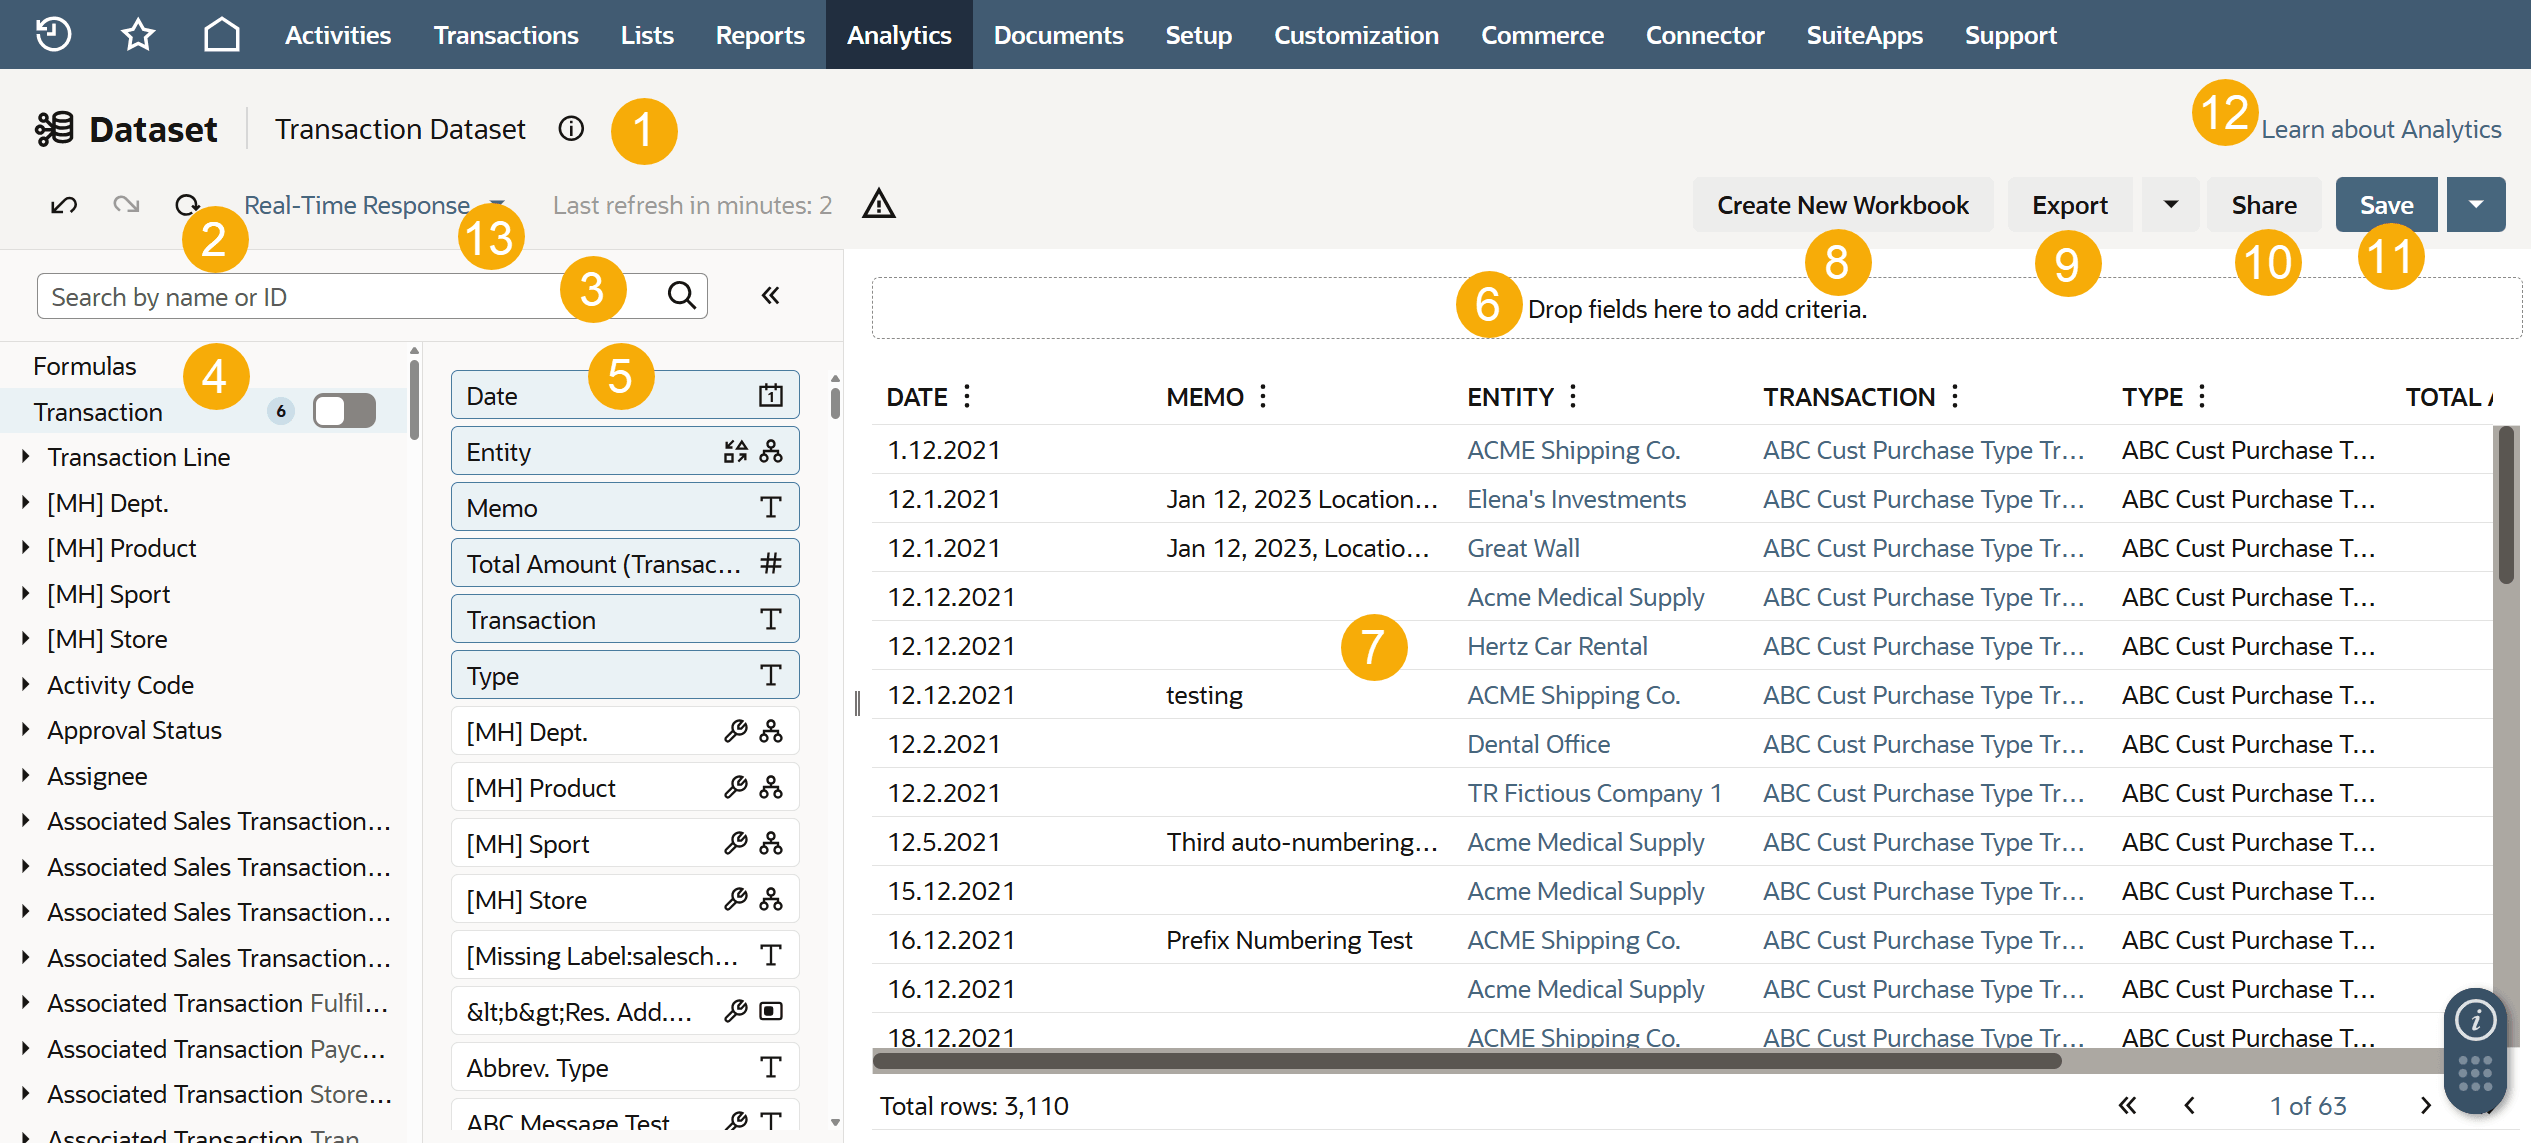
The image below shows the parts of the Dataset Builder:
The appearance of the Dataset Builder varies slightly if you access it from within a workbook or on its own. See the following table for more information.
-
Dataset Information
 - Click to view or edit the dataset name, description, or internal ID.
 -
Undo, Redo, and Refresh - Undo or redo your last changes, and refresh the data in the Data Grid.
-
Search - Search for record types and fields using keywords, field labels, or internal field IDs. The search looks at the root record type and record types up to three joins away. To search other record types, click Show more results.
-
Records list - Lists all the related record types you can access, based on the root record type selected for the dataset. If a record type has a number next to it, that shows how many fields from it are in the Data Grid. You can perform the following actions from the Records list:
Note:By default, record types and fields are listed alphabetically, except in a transaction dataset. There, the transaction line and transaction accounting line record types show up at the top.
-
To join a record type to the dataset, add one of its fields to the Data Grid or use it in a filter. For more information, see Guidelines for Joining Record Types in SuiteAnalytics Workbook.
-
To create or view custom formula fields, click Formulas. For more information about formula fields, see Formula Fields.
-
To see more information about a record type, point to its name and click the Information icon.
. -
To see the fields of a record type and update the Fields list, click the record type name.
-
To see more related record types, click the Arrow icon
 next to any record type.
 -
To see only record types that have fields in the Data Grid, click the toggle icon.
-
-
Fields list - The Fields list shows all the fields you can access for the record type you've selected in the Records list. If you click Formulas in the Records list, the Fields list shows any custom formula fields created for the dataset. At the top of the Fields list, any fields from the selected record type that are in the Data Grid are highlighted and listed alphabetically. Fields used in a filter are highlighted but not shown at the top of the list. Next to each field, these icons give you more information:
-
 : This icon means it's a custom field. For more information, see Custom Fields.
 -
 : This icon means it's a field that contains values that exist on multiple record types. For example, the customer field on the sales (ordered) record type, that has the same data as the Name/ID field in the Customer record.
 -
 : This icon means it's a hierarchical field. These fields have a parent-child relationship in NetSuite, offer different display options, and can be used to create filters based on parent or child values. For more information, see Hierarchical Fields.
 -
 : These icons show the type of values in the field- text, number, date, or Boolean.
With the Fields list, you can do the following:
-
To collapse the Records and Fields lists and expand the Data Grid, click the double arrows
 .
. -
To see more information about a field, point to it and click the
icon. -
To add a field to your dataset, double-click it or drag it from the Fields list to the Data Grid.
-
To create a filter, drag a field from the Fields list to the Criteria Builder above the Data Grid.
-
(Optional) If the field you want is already in the Data Grid, drag its header from the grid to the Criteria Builder.
Important:When you add fields from related record types to the Data Grid or use them in filters, that record type is joined to the dataset. Depending on how the related record type connects to the root record type, some joins can cause unexpected results such as data duplication. If joining record types is new to you, see Guidelines for Joining Record Types in SuiteAnalytics Workbook for more information.
-
-
Criteria Builder - The Criteria Builder shows the filters you've created for the dataset in the order that they are applied to the Data Grid, as well as the operators that connect them. For example, the filters 'Cleared is true AND Status any of Open, Paid In Full' mean the cleared field is checked first, then the status field.
Criteria filters narrow down your dataset query results and are automatically applied to any workbook visualizations based on the dataset. For example, if you filter out all invoices from your dataset, invoice data is also removed from any connected workbook visualizations.
You can add filters to the Criteria Builder by dragging fields from the Fields list to the builder, then setting the filter conditions in the Filter window. You can also drag a column header from the Data Grid to the Criteria Builder. For more information, see Dataset Criteria Filters. In the Criteria Builder, you can do the following:
-
To edit a filter, click its name.
-
To delete a filter, point to it and click Delete
 .
. -
To change the order of the filters, point to the one you want to move and click the arrows.
-
To group filters, click New Group. For more information, see Grouping Filters.
-
To change the operator between filters, click AND or OR and select a different operator from the popup window.
-
To find a field in the Fields list, point to its filter, click the Field Menu icon
 and select Show Location in Field List.
 -
To reset your filters, click Reset Criteria.
-
To hide the Criteria Builder and expand the Data Grid, click the arrow next to the criteria summary.
-
-
Data Grid - Your dataset query results are displayed in the Data Grid. By default, the grid shows preselected fields based on the root record type you selected for the dataset. You can add fields to the grid by double-clicking them on the Fields list or dragging them to the grid. The number of rows per page in the grid depends on the Number of Rows in List Segments setting in your NetSuite user preferences, up to 500 rows per page. Only fields in the grid can be used in workbook visualizations based on the dataset. In the grid, you can do the following:
-
To sort values in the grid, click the Field Menu icon
in the column header and select Sort Ascending, Sort Descending, or Edit Sort... for advanced options.For more information, see Advanced Sorting Options.
Note:If you sort your results based on a field that contains CLOB values, Workbook currently only evaluates the first 250 characters for each result. Results with more than 250 characters may not be sorted properly.
-
To filter the values in the grid, click the Field Menu icon
next to the field you want, then select Filter... from the list. The filter window appears with up to four filter types, depending on the values of the field. For more information, see Filter Types.Note:Filter conditions and sorting options set up in the Data Grid only affect what is shown in the grid and don't change values in any connected workbook visualizations. If you want to change your dataset query results and any related visualizations, set up criteria filters using the Criteria Builder above the Data Grid. For more information, see Dataset Criteria Filters.
-
To move a column, drag its header where you want it. Alternatively, click the Field Menu icon
next to the column and select a move option. -
To remove a column, click the Field Menu icon
next to it and select Remove Column. -
To rename a column, click the Field Menu icon
next to it and select Rename.... -
To change a column's width, drag the right edge of its header until it's as wide as you want.
-
To see the records linked in the grid, click the link. The NetSuite record opens in a new browser tab.
-
To see other pages, click the arrows at the bottom of the grid.
-
To see a summary of the values for any column, click its header. The summary is shown at the bottom of the grid.
-
To find a field in the Records and Fields lists, click the Field Menu icon
and select Show Location in Field List.
-
-
Create New Workbook/ Apply to Workbook - Click Create New Workbook to create a workbook based on the current dataset. If you opened the dataset from an existing workbook, click Apply to Workbook to apply your changes before saving them. This lets you preview how your changes will affect the connected workbook.
-
Export - Click Export and choose one of these options:
-
Export data to CSV
Note:To export data from the Data Grid to a CSV file, you need the Export Lists permission.
-
Export dataset to SDF XML
-
Export dataset to SuiteQL TXT
-
-
Share - Share your dataset with users or roles. For more information, see Accessing and Sharing Workbooks and Datasets
-
Save - Save your dataset, including any joined record types, custom formula fields, or filters. If you don't own the dataset you're working in, you need to save a copy using Save As.
-
Learn about Analytics - Click Learn about Analytics to open a panel with all SuiteAnalytics Workbook videos and their descriptions. To watch a video, click the thumbnail and it opens in a new window.
-
Real-Time / Cached Response - If you're experiencing long load times for your datasets or workbooks, you can turn on Cached Data in Datasets. For more information, see Optimized Data Refresh.