Viewing Your Report as a Pie Chart, Bar Graph or Line Graph
Graph output type is no longer the preferred way to view reports and saved searches. To see your data in a graph, use the SuiteAnalytics Workbook chart capabilities instead. For more information about how to use charts in SuiteAnalytics Workbook, see Workbook Charts.
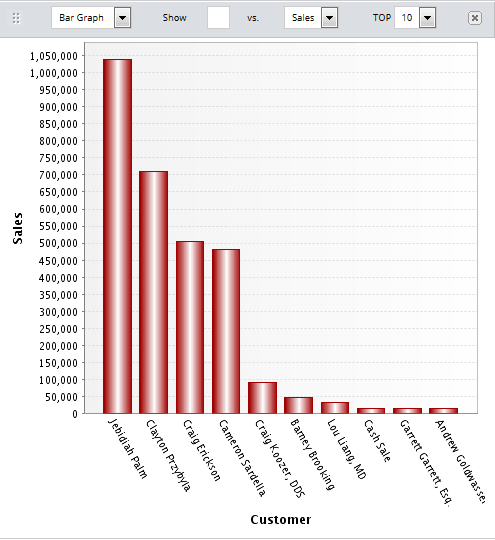
You can view your report as a chart or graph for an different visual perspective. You can also choose how much data to show on your graph, so you see only the top values for that report.
To view your report as a pie chart or bar graph, click the Graph button in the report footer. NetSuite automatically generates a graph of your report using the default settings. In the Graphing window, you can choose a bar graph or pie chart, select amounts to compare, or select how many top values to show.
You can't graph a Detail report.