Sales Audit Report
Sometimes called the Daily Sales Report (DSR), the NetSuite Point of Sale (NSPOS) Sales Audit Report is part of the End of Day process. The report runs automatically after counting a till/cash drawer. You can run this manually by following the steps below.
Use this report to review key sales-performance indicators, totals by payment type, and counts for each type of transaction performed. The standard report lists your current location and business day, but you can choose to run it for a different location, specific registers/workstations, operators and tills, and choose a range of business days.
To manually run a Sales Audit Report:
-
In Sales Mode, complete all sales transactions.
-
From the main button bar, tap Reports and then tap Sales Audit.
If you don't see the Reports button, press Ctrl+F12 and enter
Sales AuditorRAPOS Sales Audit. -
To filter transactions for different locations, workstations, or other criteria:
-
Options include selecting the store, workstation (register), and operator from a list. You can change the dates and enter a Till ID. Some filters require clearing the Null box. You can include transaction and deposit data from NetSuite ERP by selecting True.
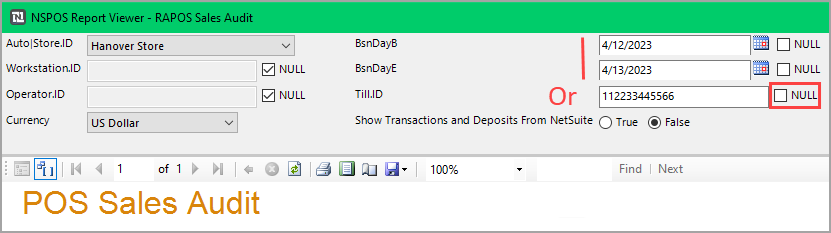 Important:
If you enter a Till ID, the filter will ignore the business day beginning (BsnDayB) and end (BsnBdayE) dates. Instead, the report will list all transactions for the session logged to the Till ID.
-
Tap View Report.
-
-
To print or save and export the report, choose from the options at the top.
-
Tap X in the upper right to return to the Journal window.
Filtering a Sales Audit Report
The criteria used to filter the Sales Audit report is based on a business day. The business day is the calendar date on which the till beginning count was performed.
Make sure cashiers log out at the end of their shift. Leaving a same-day shift without logging out can cause the user session to extend to the next calendar date.
The business day assigned to a user session's transactions begins when the cashier logs in and ends when they log out. If a user session extends beyond one calendar date, the business day for transactions occurring on the next calendar date will use session's beginning date.
This setup allows for overnight cashier shifts, such as a 6:00 p.m. to 2:00 a.m. shift, to be searchable using session criteria.
Running End of Day closes all open sessions. You can filter a report by calendar date to see "true" transaction dates.
This example shows how not logging out can affect transaction data. It also lists how to adjust report criteria to compensate for the effects caused by sessions that overlap calendar dates.
- Business Day Start -
Calendar Date 1 - Cashier logs in to begin user session. End of Day (EOD) was run on the register before cashier logged in.
-
Cashier creates Sales Transaction A.
-
Run Sales Audit report for Calendar Date 1 (current business day).
Calendar date and business day for transaction A is correct on report.
-
Cashier ends shift without logging off.
Calendar Date 2 - Cashier is still logged in, EOD was not run.
-
Cashier creates Sales Transaction B
-
Run Sales Audit report for Calendar Date 2.
Transaction B is not found in report.
-
Change filter criteria to Calendar Date 1 (as shown in the Sales Audit report steps).
Transaction A and Transaction B are listed in report.
- Business Day End -
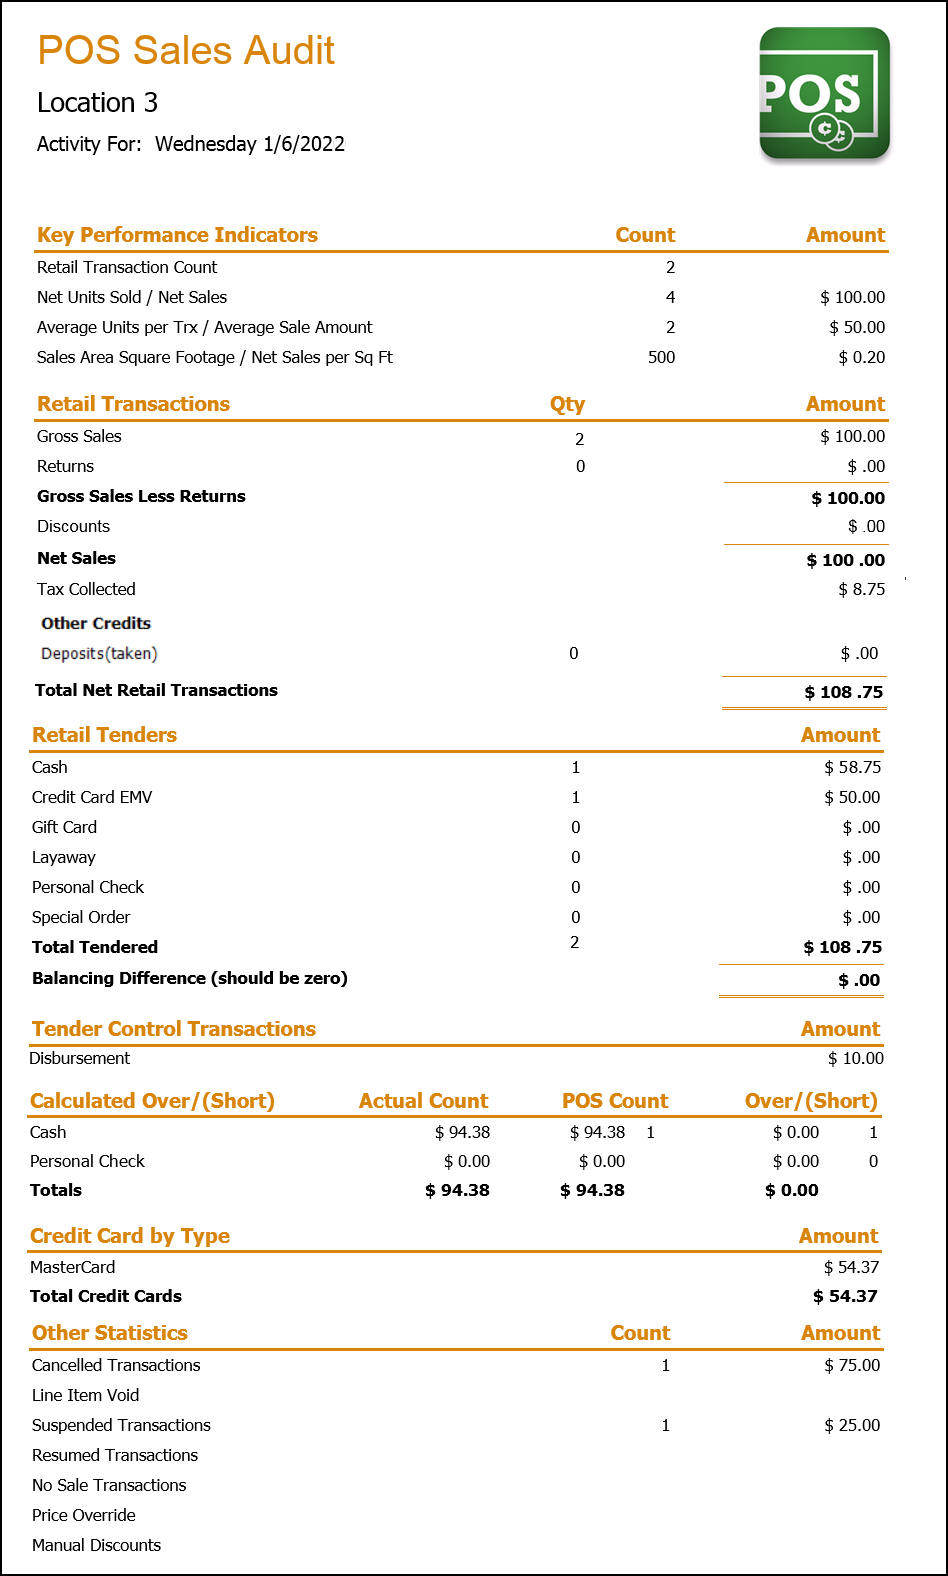
Sales Audit Report fields
|
Field |
Description |
|---|---|
|
Key Performance Indicators |
Key indicators that measure store performance by the transactions and units sold based on the size of the sales area. |
|
Retail Transaction Count |
The number of sales or other transactions that occurred in NSPOS. The default report does not include a transaction count of NetSuite ERP activity, but you can select to Show Transactions and Deposits From NetSuite. |
|
Net Units Sold / Net Sales |
Number of net units sold divided by the net total sales. |
|
Average Units per Trx / Average Sales Amount |
Average units sold per transaction divided by the average sales transaction amounts. Calculations do not include returns. Average Sale Amount = (Gross Sales - Discounts) / Retail Transaction Count |
|
Sales Area Square Footage / Net Sales per Sq Ft |
If available, the square footage of the store area dedicated to merchandise sales divided by net total sales. |
|
Count |
Number of transactions, units sold, average units sold and sales area size. |
|
Amount |
Total amounts and average amounts for each key performance indicator. |
|
Retail Transactions |
Totals from transactions performed at the register during the shift. |
|
Gross Sales |
Gross sales calculated as the total items sold from transactions that were completed. The sum does not include canceled or suspended transactions. |
|
Returns |
The portion of gross sales that were returned. |
|
Gross Sales Less Returns |
Quantity of gross sales remaining after subtracting returns. |
|
Discounts |
Total discounts applied to gross sales without returns. |
|
Net Sales |
Gross sales - (returns + discounts) |
|
Tax Collected |
Total taxes collected. |
|
Other Credits |
Miscellaneous credits applied to transactions during the reporting period. |
|
Deposit (taken) |
Number of deposits and total deposits taken for sales orders. |
|
Total Net Retail Transactions |
Total net sales and tax collected. |
|
Qty |
Number of transaction components. |
|
Amount |
Total value of each transaction component. |
|
Retail Tenders |
Number of payment types tendered, such as cash or credit card, and the total amounts taken for each type. |
|
Total Tendered |
Total value of transactions by each tender type. |
|
Balancing Difference (should be zero) |
Total Tendered - (Gross Sales + Returns + Tax Collected + Deposits) |
|
Tender Control Transactions |
Transactions such as disbursements and tender loans that adjust the till totals. |
|
Amount |
Total of each tender control transaction. |
|
Calculated Over/(Short) |
Manual cash and personal check amount counts versus the amounts processed as transactions in the POS. Used to determine overages or shortages in the till. |
|
Actual Count |
Manual total count from till. In this example, till began the day with $40 cash. |
|
POS Count |
Calculated total till count as determined from the start of day count and all cash or check transactions. This is the expected total. Includes the number of transactions using cash or personal check as the payment method. |
|
Over/(Short) |
The difference between the physical Count and the POS Count. |
|
Credit Card by Type |
Number of transactions by credit card type, such as MasterCard or Visa. |
|
Amount |
Total transactions for each card type. |
|
Other Statistics |
Counts and totals of events such as canceled or suspended transactions. |
|
Count |
Number of occurrences for each event type. |
|
Amount |
Totals for each event type. |