Introduction to Workbench Dashboards
This chapter introduces the Oracle Health Insurance Data Exchange Cloud Service (DECS) Operations Workbench dashboards. These dashboards provide a comprehensive view of real-time data exchange activity for a specific Line of Business, offering a variety of visualizations to help you monitor inbound and outbound transmissions.
The available visualizations include:
-
Tasks Summary: Provides an overview of tasks, categorized as assigned tasks and transmission volume, segregated by trading partner.
-
Transmission over Time Period: Tracks activity within a specific line of business over various timeframes (day, month, year). This section highlights the number of transactions processed within the chosen timeframe.
-
Runtime Repository Activity: Reflects changes occurring within the runtime repository, including purging runtime instance data, processing new messages, and generating error messages. Users can specify the desired data period and manually refresh the data for real-time updates.
-
File Receipt Details: Provides information on how the file was received and the number of transactions it was subsequently divided into.
-
Transaction Hierarchy: Enables users to navigate through different transaction levels, including details of the Electronic Data Interchange (EDI) received for that specific transaction.
-
Data Transformation Insights: Offers insights into how transactions are processed, showcasing the raw format, the DECS canonical format, and the final mapping to the Oracle Health Insurance payload.
Before You Start
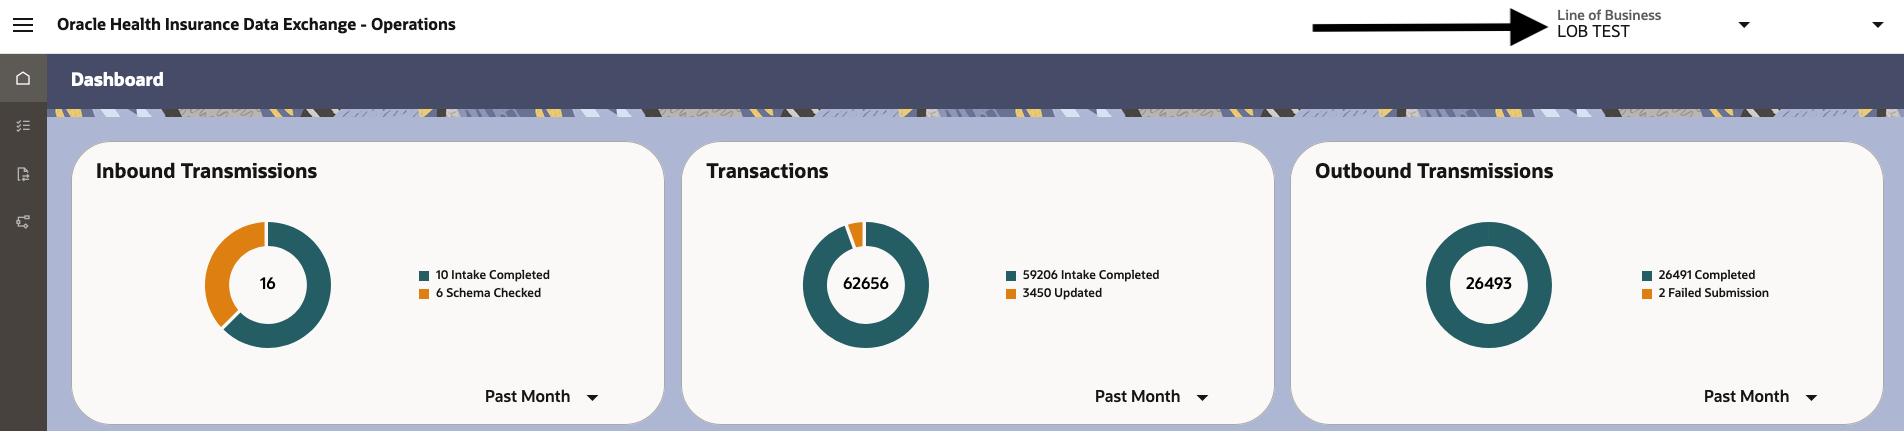
When you start working on the Operations Workbench, you must select the required Line of Business from the drop-down in the upper right-hand corner of the dashboard.
The list of Inbound Transmissions and Outbound Transmissions shown in the Operations Workbench depends on your chosen Line of Business.
Different Sections of the Operation Dashboard
The Operations Workbench dashboard includes several key sections, each offering specific insights into data exchange activity.
| Section Name | Description |
|---|---|
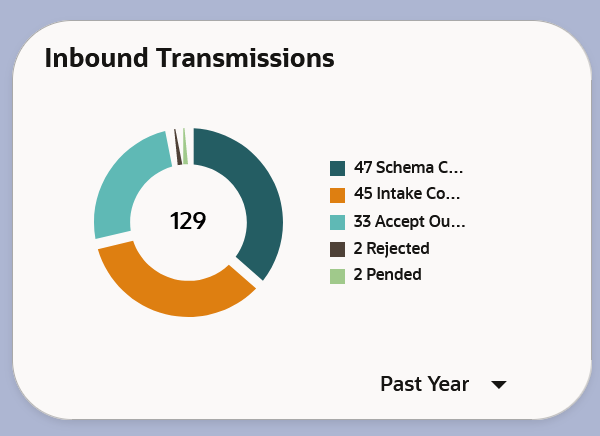
Inbound Transmissions
|
This section displays a pie chart graph that summarizes the status of inbound transmissions. This helps you to monitor the flow of incoming data. See Inbound Transmissions. |
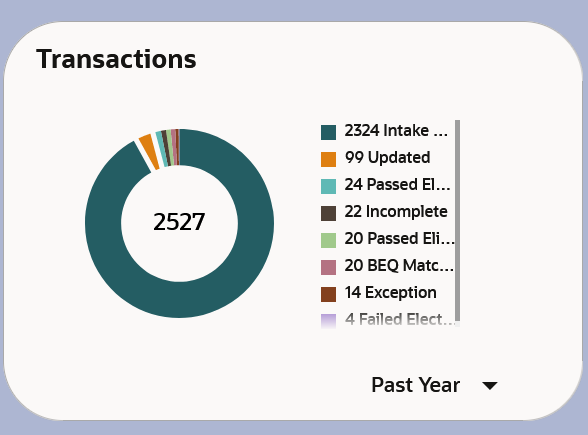
Transactions
|
This section provides a pie chart summarizing status of all transactions received on inbound transmissions in DECS. See Inbound Transmission - Related Transactions. |
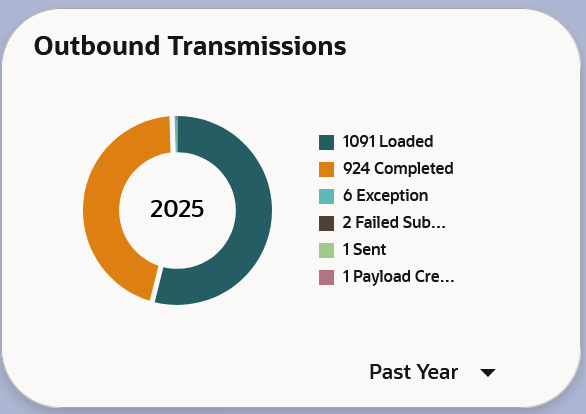
Outbound Transmissions
|
This section displays a pie chart summarizing status of all outbound transmissions. This helps you manage outgoing data. See Outbound Transmissions. |
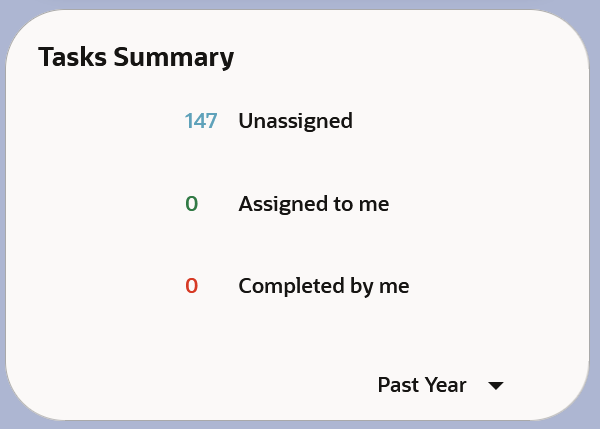
Tasks Summary
|
This section provides a summary of assigned tasks that include unassigned tasks from your user group, tasks assigned to you, and completed by you. See My Tasks. |
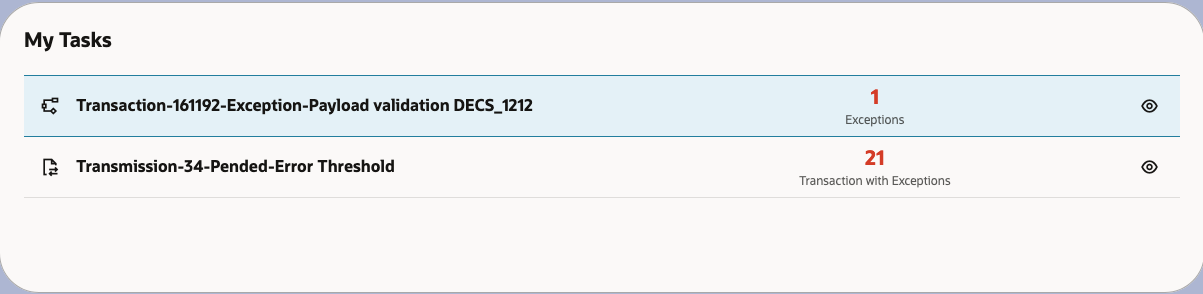
My Tasks
|
This section displays high priority tasks assigned to you. See My Tasks. |
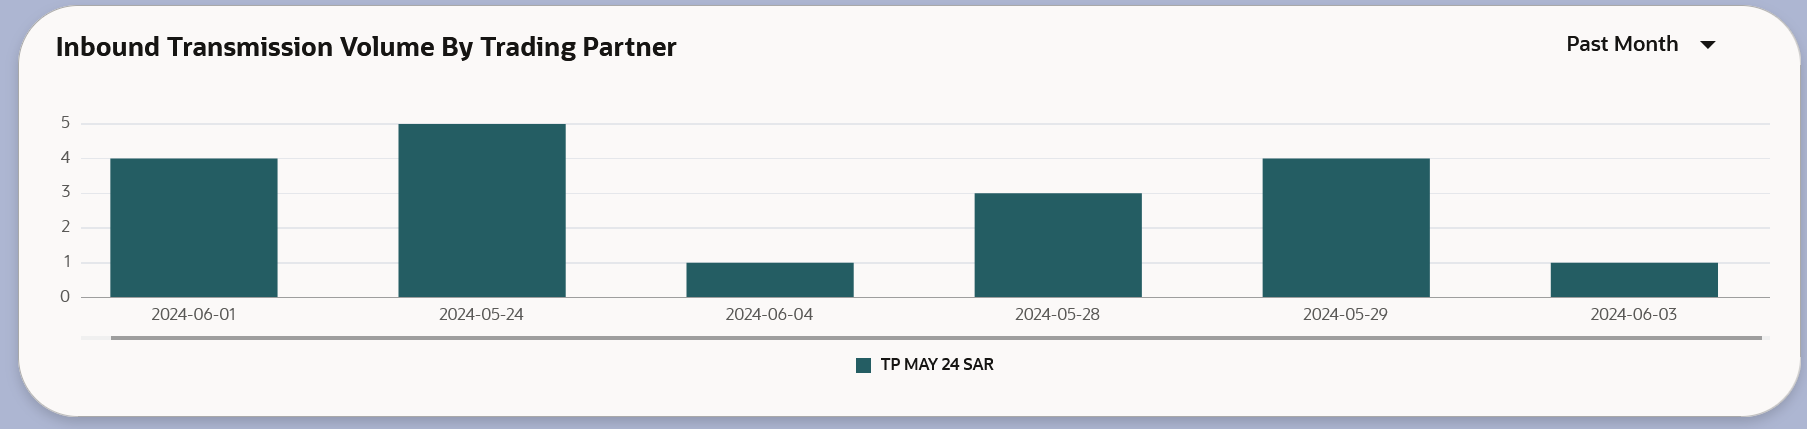
Inbound Transmission Volume By Trading Partner
|
This section uses bar chart to display the volume of inbound Transmissions, grouped by trading partner. |
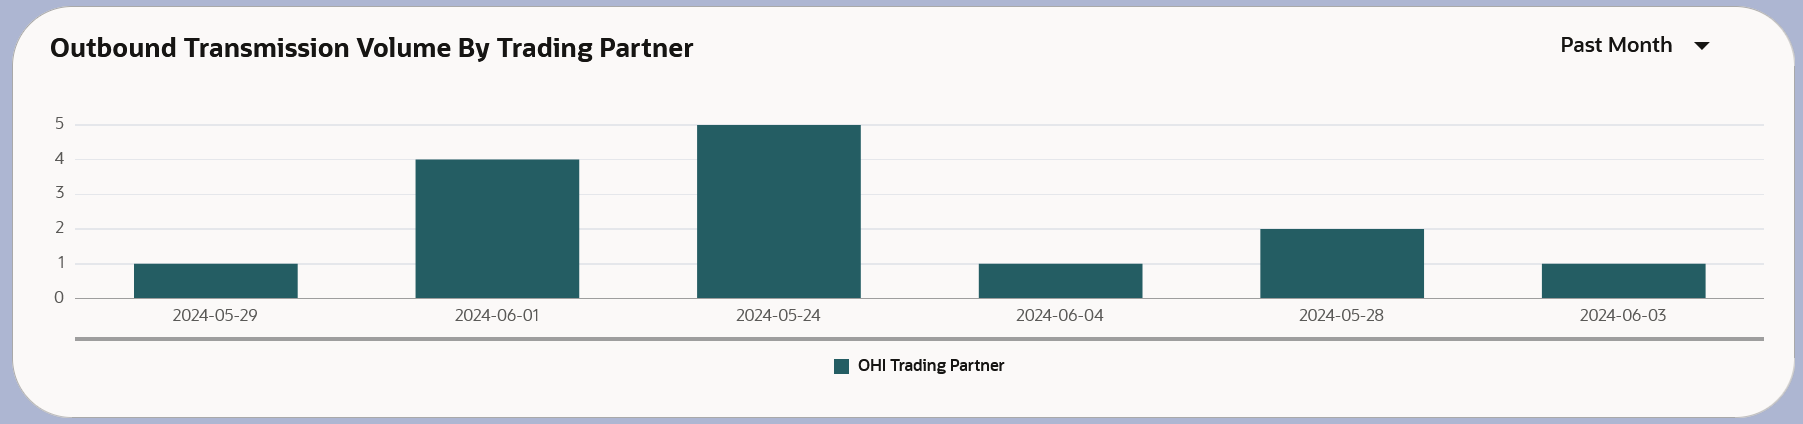
Outbound Transmission Volume By Trading Partner
|
This section uses bar chart to display the volume of outbound Transmissions, grouped by trading partner. See Outbound Transmission Info. |