Special Format Reports
FSG lets you add special formatting to your reports and create custom reports which meet specific business needs. You do this by taking a simple report and adding other report definitions and report objects. For example, you can define your own column sets instead of using the standard column sets.
Topics in This Section
Column Set Builder
Format Masks
Column Headings
Relative Headings
Calculations
Row Orders
Exception Reports
Display Options
Rounding Options
Override Segments
Column Set Builder
To simplify defining column sets, FSG provides the Column Set Builder--a graphical tool for building report layouts.
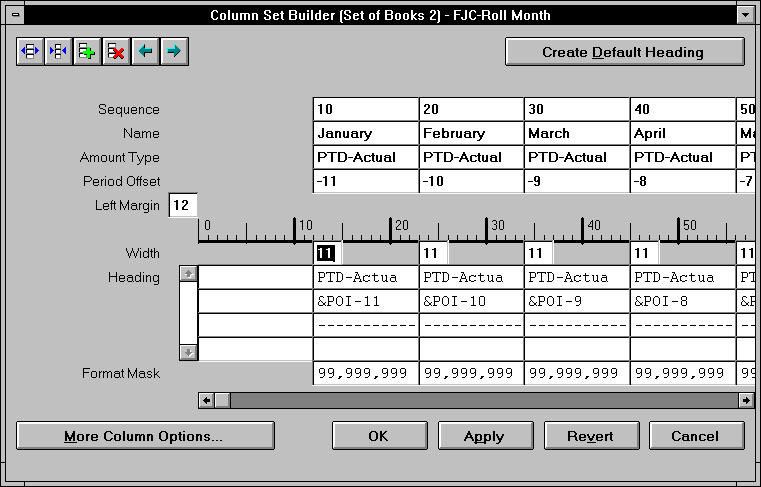
Figure 1 - 5.
Column Set Builder Window

The Column Set Builder displays column definitions graphically, which makes it easier to lay out your reports, and gives you a good idea of how a report will look after FSG runs it.
There are two main areas to the Column Set Builder window. The top half is used to define each column, and the bottom half is used to create custom headings and enter format masks for each column definition.
Column Definition Area
For each column definition, you enter four pieces of information; Sequence number, Name, Amount Type, and Period Offset. Unlike row sequence numbers, column sequence numbers do not control the order FSG displays report columns. Columns are displayed on your reports in exactly the order they appear in the Column Set Builder window. You refer to a column's sequence number when you define calculations in another column (more on this later).
Recall that most columns are defined using an amount type. General Ledger provides numerous amount types, which define a period type and balance type. For example, the amount type QTD-Actual specifies a quarterly period type and actual balances. The amount type YTD-Encumbrance specifies a yearly period type and encumbrance balances.
FSG uses the Period Offset to determine which specific periods' balances to include on a report. Period offsets are specified relative to the period you specify when you request that FSG run a report. For example, if you want a report of monthly cash balances for January, 1996 through December, 1996, the period-of-interest is DEC-1996. If one of your column definitions has a period offset of 6, FSG will display the cash balances for June, 1996 in that column.
Headings Area
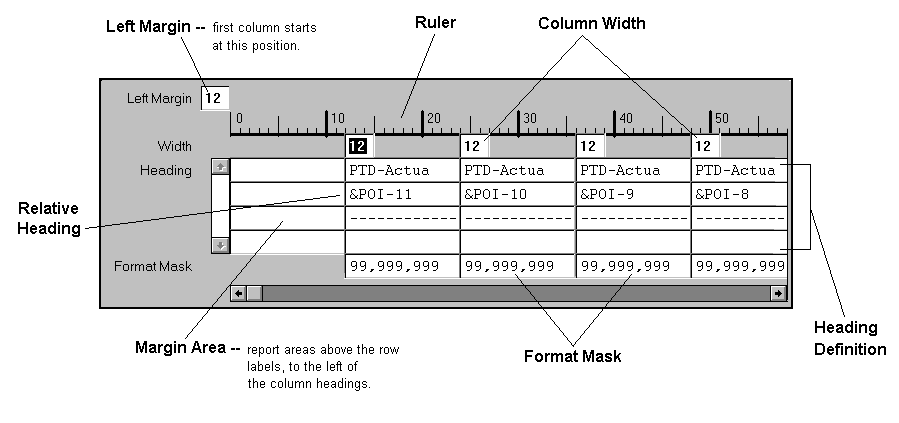
Figure 1 - 6.
Column Set
Builder,
Headings
Area

Other than format masks and relative headings, which are explained in separate sections, the most important thing to note about creating column headings is the positioning of columns across the report. Two factors control this:
Left Margin: This is the starting position of the leftmost column, to reserve space for FSG to print your report's row labels.
Column Width: Each column has a specific number of print positions defined, know as the column width. The width must be large enough to hold all printable characters, including currency symbols, decimal points, and number separators.
Format Masks
A format mask defines how numbers are displayed in your reports. You can specify numbers, decimal places, currency symbols, and other display characters. For example, if you use a format mask of $99,999,999, FSG will display the number 4234941 as $4,234,941.
Note: To use all of the available formatting options, additional set up steps may be required in General Ledger.
The most important thing to remember when using format masks is to make sure you include enough space in your column definition to print all the numbers and special characters allowed by the format mask you use.
Column Headings
Headings can include any alphabetic or numeric characters. They may also include special characters, except for the ampersand symbol (&). FSG also provides a default heading option, which you can use as is or modify to build a custom heading.
Relative Headings
You use FSG's Relative Headings feature to define dynamic headings whose content changes depending on some value you provide when you request the report.
You define relative headings by combining:
- An ampersand (&) -- Identifies the following token and number as a relative heading.
- A token -- Representing period of interest (POI), budget (BUDGET), encumbrance (ENCUMBRANCE), or currency (CURRENCY). The most often used token is POI.
- A number -- For POI relative headings, the number is a period offset. For budgets, encumbrances, and currencies, the number is an associated control value.
Note: The number is expressed as a positive or negative value. For negative values, the minus sign (-) is required. For positive values, the plus sign (+) is optional.
For example, &POI-10 indicates the tenth period before the period of interest. &POI+6 or &POI6 indicates the sixth period following the period of interest. POI0 is the period of interest.
For another example, look at Figure 1 - 6 again, the Column Set Builder Headings Area. The example column set produces a rolling monthly report. In other words, the report has twelve columns representing monthly actual balances. The twelfth monthly column is defined to display values for the period of interest. The first monthly column is defined to display values for the period which is eleven months before the period of interest.
For illustration purposes, the following table shows how the first and twelfth columns are defined and how the related report columns will be displayed. Note that the column definitions for &POI-10 through &POI-1 are not shown.
Period of interest: December 1996
|
| Amount Type
| PTD-Actual
| PTD-Actual
|
| Period Offset
| 11
| 0
|
|
|
|
|
| Heading line 1
| PTD-Actual
| PTD-Actual
|
| Heading line 2
| &POI11
| &POI0
|
| Heading line 3
| ------------
| ------------
|
|
|
|
|
Report Column
Heading Display
| PTD-Actual
JAN-96
------------
| PTD-Actual
DEC-96
------------
|
Using relative headings with period offsets is a great way to create generic column sets which can be used with numerous FSG report definitions.
Calculations
You can create a row or column definition to calculate values which are then displayed on your report. This is especially useful for adding subtotals, totals, variances, and percentages to your reports. You can also create non-displayed rows or columns to hold the results of intermediate calculations, that are used in other calculations.
As with client-based spreadsheet programs, you can use other rows or columns in your calculations. For example, you can define a calculated row which adds a range of other rows to arrive at a subtotal. Or, you can define a calculated column which subtracts one column from another to yield a variance column.
FSG provides a wide range of operators you can use in calculations, including functional operators such as Average, Median, and StdDev (standard deviation), and, of course, your computations can include constant values.
Row and Column Conflicts
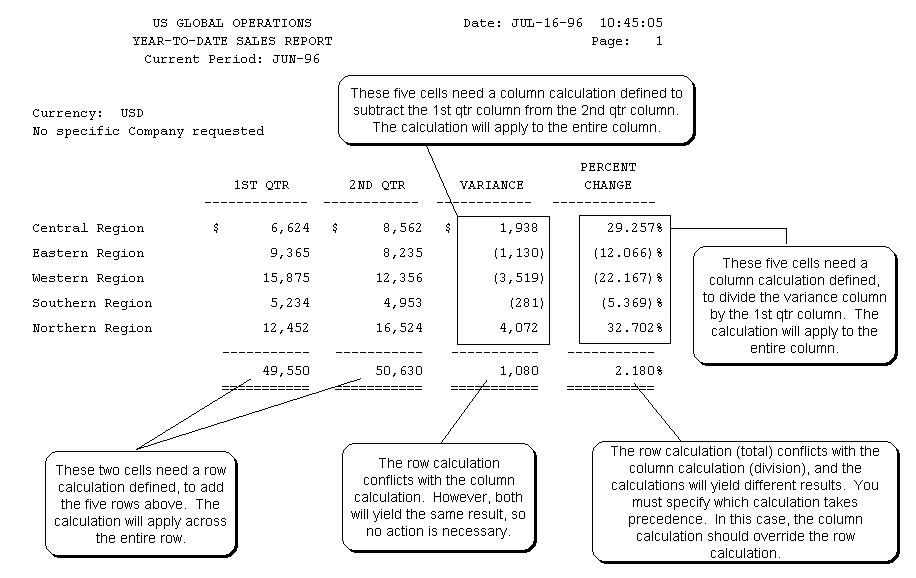
Calculations are one example of where a row definition and a column definition might conflict. For example, consider the following report:
Figure 1 - 7.
Row and
Column
Conflicts

When there are conflicting calculations in a report, FSG will use the column calculation instead of the row calculation, unless you tell FSG (in the row definition) to override any conflicting column calculations.
There are other situations besides calculations where row and column definitions might conflict, such as format masks, period offsets, and amount types. FSG follows a set of precedence rules for all such row/column conflicts. For more information, see Row and Column Overrides.
Row and Column Names
When creating a calculation row which uses another row in the calculation, you refer to the row by its assigned Sequence Number. Optionally, you may give the row a Row Name when you define it, then refer to the name when building a calculation. The same rules apply to columns.
If you use the optional row and column names, the names will appear in other FSG windows, making it easier to remember what those rows or columns represent. Also note that if you use row and column names in your calculations, the names must be unique within the row set or column set. If not, your calculations may yield incorrect results.
Row Orders
There are three key things which you can do in your reports, using FSG's Row Orders feature:
- Display account segment values and their descriptions. There is a Display option on the Row Order window where you can tell FSG to display the value, description, or both for your account segments. So, instead of 01.200.1000, you can have FSG display 01 ABC Company. 200 Headquarters. 1000 Cash. Optionally, you can display the description or account segment value by itself.
- Change the account segment order. There may be times when you want to change the order in which your account segments print. For example, your natural account might be defined as the third segment, but you want it to print first.
- Sort detail rows based on values in a column. You can tell FSG to sort your report's detail rows based on the values in one of your columns. For example, let's say you've built a sales report which displays current month sales figures for each of your 150 sales offices. If you want to sort this report from highest to lowest sales amount, you simply define a Row Order to tell FSG to sort the sales column in descending order.
Note: A row order can be saved as part of a report definition, or can be added dynamically at the time you request an FSG report.
Exception Reports
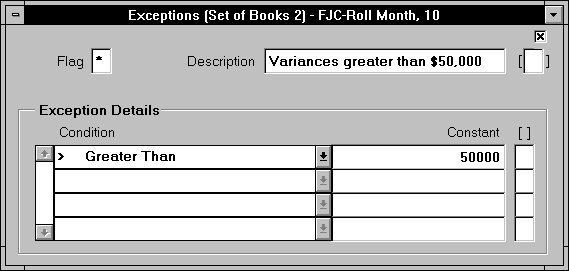
Exception reports are very easy to build in FSG. When you define a column set, you can also define exception conditions for any or all of your column definitions. FSG will apply these exception conditions to any report which uses the column set.
For example, assume you're building a variance report and you want to flag any variance amount which exceeds $50,000. In the variance amount column definition you simply create an exception condition which tells FSG, "if the amount in this column is greater than 50000, print an asterisk character." Here's the related Exceptions window:

Display Options
FSG provides a number of additional display options you can apply to the rows and columns in your reports. These include:
- Display or don't display a row or column: You can define rows or columns which are not displayed on a report. You might use such rows or columns to perform intermediate calculations which you don't want on the report itself, but which are needed to build the values you do want.
- Display or don't display when balance is zero: You can choose to suppress the display of rows and columns whose balance is zero.
- Change sign: General Ledger stores debits as positive numbers and credits as negative numbers. FSG will print such values with their respective signs. You can choose to change the sign, printing debits with negative signs and credits with positive signs. For example, to print revenue (credit) amounts on an income statement so they appear without negative signs, set the Change Sign option for any rows or columns which use revenue accounts in an account assignment range.
Suggestion: If you want FSG to suppress the display of positive signs, set the profile option Currency:Positive Format.
- Display factors: You can select to display amounts on your report at different precision levels, or factors, such as units, thousands, or millions. FSG will perform the appropriate rounding to arrive at the factor you've chosen.
- Level of detail reporting: This feature lets you indicate the level of detail so you can screen out excessively detailed information when you run reports for a high-level audience. Level of detail is indicated for each row and column, as well as for a report. When the report prints, FSG will display only those rows and columns whose level of detail are the same as or less than that of the report.
With this feature, you can use the same row set and column set definitions to define multiple versions of the same report, to serve different levels of your organization.
Rounding Options
You control how FSG performs any rounding which results from calculations you've defined for your report's columns or rows. In some cases you will want FSG to perform the calculations before any rounding is done. Other times, you may want the rounding to be done before the calculations are made. FSG lets you control this when you define your reports.
Note: The rounding option can be saved as part of a report definition, or can be added dynamically at the time you request an FSG report.
Override Segments
You use the override segments feature to produce "breakdown" reports. For example, let's say that you've defined a report which produces a corporate income statement. Now you want to create a breakdown version of the same report which shows income statement line items for each department, one report column per department. Department is one of your account segments, and can have one of five values (01 = Sales, 02 = Manufacturing, 03 = Finance, 04 = Administration, 05 = Corporate).
The original report definition uses a row set named Income Statement and a column set named Corporate YTD-Actual. To produce the breakdown report, you need to define a new column set with the following properties:
- Uses the Department segment as an "override segment."
- Includes one column definition for each department.
- Specifies, for each column definition, the department segment value as its override value. For example, the first column would be defined with an override value of 01, for the Sales department.
- (Optional) Define a column to total all the departments.
When you are done, your column set definition might look like this:
Column Set Name: Department Breakdown
|
| Sequence
| 10
| 20
| 30
| 40
| 50
|
| Amount Type
| YTD-Actual
| YTD-Actual
| YTD-Actual
| YTD-Actual
| YTD-Actual
|
| Width
| 12
| 12
| 12
| 12
| 12
|
| Factor
| Units
| Units
| Units
| Units
| Units
|
| Format Mask
| 999,999,999
| 999,999,999
| 999,999,999
| 999,999,999
| 999,999,999
|
| Override Value
| 01
| 02
| 03
| 04
| 05
|
Column
Heading
| Sales
----------
| Manufact.
----------
| Finance
----------
| Admin.
----------
| Corporate
----------
|
Now you need only create a new report definition using row set Income Statement and column set Department Breakdown. At this point, you will have two defined reports which produce different versions of the same report.
See Also
Report Building Concepts
Simple Reports
Report Distribution
Other FSG Features
Overview of the Financial Statement Generator
Using Financial Statement Generator
GL Desktop Integrator Report Wizard
Using the Column Set Builder
Amount Types
Creating Column Headings
Format Masks
Relative Headings
Defining Report Calculations
Row and Column Overrides
Defining Row Orders
Defining Column Exceptions
Display Options


