Step 1: Repeatability
The first step is to set up a debug target and configure the target so the
bug can easily be repeated by clicking Restart  .
.
-
If you have not yet compiled the example program, do so by following the instructions in Example Program.
-
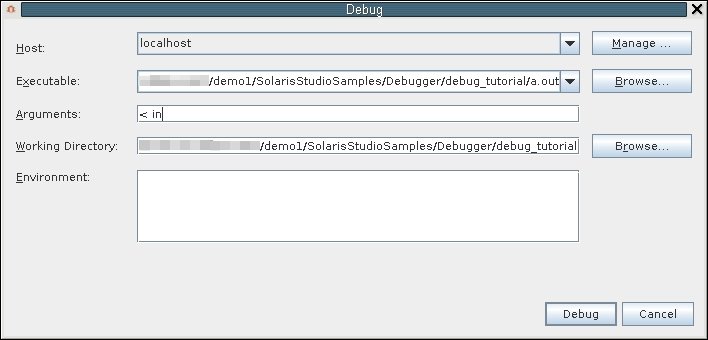
Choose Debug → Debug Executable.
-
In the Debug Executable dialog box, browse for or type the path to the executable.
-
In the Arguments field, type:
< in
The directory portion of the executable path is displayed in the Working Directory field.
-
Click Debug.

Start debugging the program as follows:
In a real world situation, you might want to populate the Environment field as well.
When debugging a program, dbxtool creates a debug target. You can use the same debugging configuration by choosing Debug → Debug Recent and then choosing the desired executable.
You can set many of these properties from the dbx command line. They will be stored in the debug target configuration.
The following techniques help sustain easy repeatability. As you add breakpoints, you can quickly go to a location of interest by clicking Restart without having to click Continue on various intermediate breakpoints.