Using Breakpoints and Stepping
Breakpoints enable you to stop a program before the manifestation of a bug and step through the code in the hope of discovering what went wrong.
If you have not already done so, undock the Output window.
You ran the program from the command line earlier. Reproduce the bug by running the program in dbxtool.
-
Click the Restart button
 on the toolbar or type run in
the Debugger Console window.
 -
Press Return in the Debugger Console window.
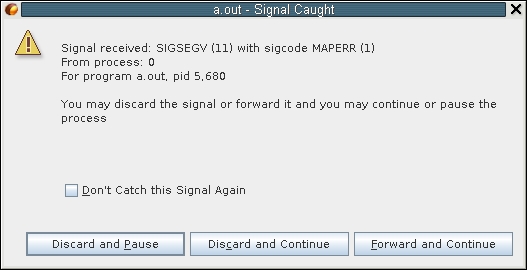
An alert box provides information about the SEGV.

-
In the alert box, click Discard and Pause.
The Editor window once again highlights the call to strcmp() in Interp::find().
-
Click the Make Caller Current button
 in the toolbar to go to the unfamiliar code you
saw earlier in Interp::dispatch().
 -
In the next section, you will set a breakpoint a bit before the call to find() so you can step through the code to learn why things went wrong.