Step 2: First Breakpoint
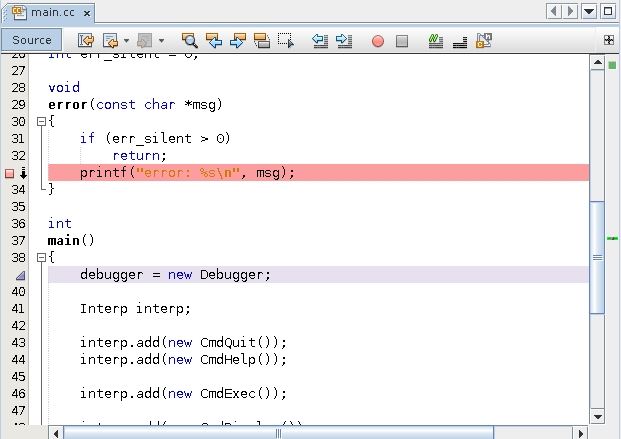
Put the first breakpoint inside the error() function in the case where it prints an error message. This breakpoint will be a line breakpoint on line 33.
In a larger program, you can easily change the current function in the Editor window by typing the following, for example, in the Debugger Console window:
(dbx) func error
The lavender stripe indicates the match found by the func command.
-
Create the line breakpoint by clicking in the left margin of the Editor window on top of the number 33.

-
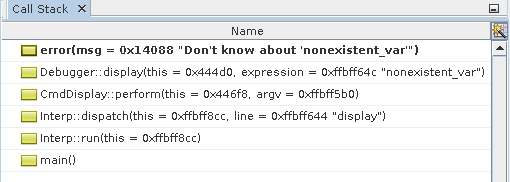
Click Restart
 to run the program and upon hitting the
breakpoint, the stack trace shows the error message that is
generated due to the simulated command in the
in file:
to run the program and upon hitting the
breakpoint, the stack trace shows the error message that is
generated due to the simulated command in the
in file:> display var # should yield an error
The call to error() is expected behavior.

-
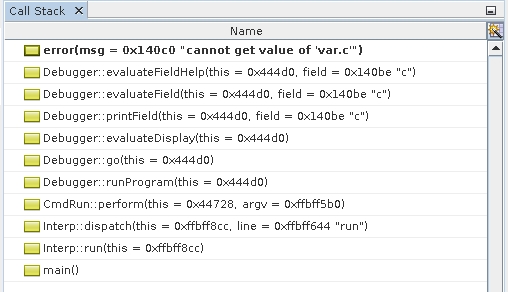
Click Continue
 to continue the process and hit the
breakpoint again.
 An unexpected error message appears.
