Setting Breakpoints
You can set a breakpoint in several ways, such as a line breakpoint or a function breakpoint. The following list explains the several ways to create a breakpoint.
Note - If the line numbers are not showing, enable line numbers in the editor by right-clicking in the left margin and selecting the Show Line Numbers option.
-
Setting a Line Breakpoint
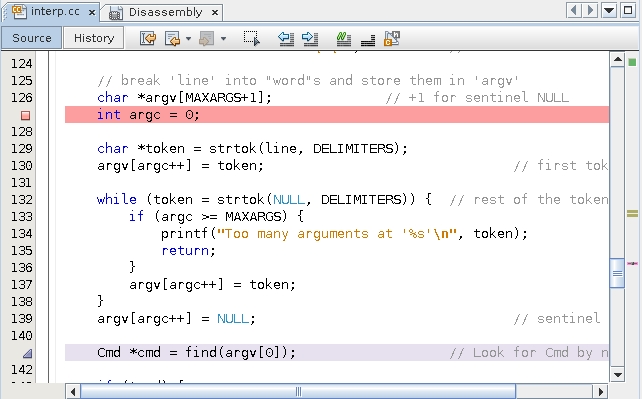
Toggle a line breakpoint by clicking in the left margin next to line 127.

-
Setting a Function breakpoint
Set a function breakpoint.
-
Select Interp::dispatch in the Editor window.
-
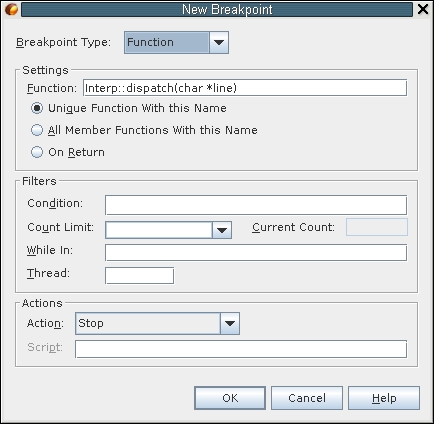
Choose Debug → New Breakpoint or right-click and choose New Breakpoint.
The New Breakpoint dialog box appears.

Notice that the Function field is seeded with the selected function name.
-
Click OK.
-
-
Setting a Breakpoint from the Command Line
The easiest method to set a function breakpoint is from the dbx command line. Type the stop in command in the Debugger Console window:
(dbx) stop in dispatch
(4) stop in Interp::dispatch(char*)
(dbx)
Notice that you did not have to type Interp::dispatch. Just the function name sufficed.
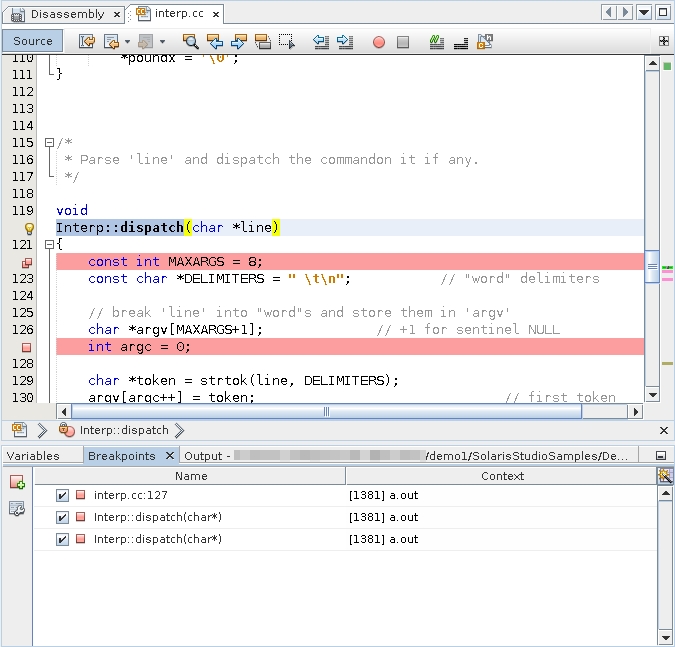
Your breakpoints window and Editor probably look like the following:

To avoid clutter in the Editor, use the Breakpoints window.
-
Click the Breakpoints tab (or maximize it if you minimized it earlier).
-
Select the line breakpoint and one of the function breakpoints, right-click, and choose Delete.
For more information about breakpoints, see Chapter 6, Setting Breakpoints and Traces, in Oracle Solaris Studio 12.4: Debugging a Program With dbx .