The following dashboard components are available under this category:
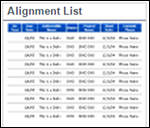
Alignment List
This chart displays the list of child nodes with their Measure values for selected Alignment node. You can click on a link to drill down to next level in the Alignment hierarchy. You can also click on data or chart icons on a particular row to change the view. If there is more than one Alignment defined in the system, you must select one Alignment to display as a default. You can change this later.
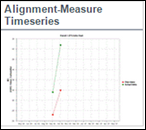
Alignment-Measure Time series
This chart displays Measure Data on Y-Axis for selected Alignment node and the reporting period of X-Axis. For multi-Initiative system, choose an initiative that is to be displayed.
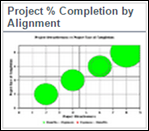
Project % Completion by Alignment
This chart displays the Percent Completion on Y-Axis for projects that qualify the filter criteria and Project Alignment (Strategy) on X-Axis. You can click on a bubble to drill down to the individual project.
Dashboard Component Properties
Component Name | Data Available for X-axis | Data Available for Y-axis | Category | Sub-Category | Default Drill Down | Optional Drill Down | Supported Chart Type |
|---|---|---|---|---|---|---|---|
Alignment List | Alignment Nodes |
| Alignment |
| Measure List, Data and Chart |
| Table |
Alignment-Measure Timeseries | Measure Value | Date Range | Alignment |
|
|
| Line |
Project % Completion by Alignment | % Complete | Alignment | Alignment |
| Project Basics Page |
| Bubble |
See Also
Legal Notices
Copyright © 2000, 2016,
Oracle and/or its affiliates. All rights reserved.
Last Published Tuesday, June 21, 2016