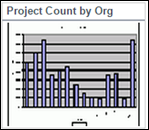
Project Count by Org
The chart displays the number of projects on Y-Axis that qualify the filter criteria and Organization on X-Axis. You can select different level of organization to show on the X-Axis from the filter criteria. Projects that aligned to multiple organizations will be counted in multiple organizations. You can click on a bard to drill down to the list of projects that contribute to the bar.
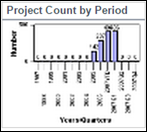
Project Count by Period
The chart displays number of projects on Y-Axis that qualify the filter criteria and reporting period on X-Axis. Projects that start in one year and end in the next year will be counted in both years.
Current quarter figures are as of the current date. Current year is displayed as YYYYYTD e.g. 2009YTD. YTD means Year to Date. Prior quarter and year-end figures are as of the last day of the period. Click on a bar to drill down to the list of projects that contribute to the bar.
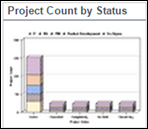
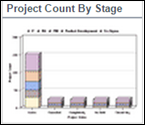
Project Count by Status
The chart displays the number of projects on Y-Axis that qualify the filter criteria and Current Project Status on X-Axis. The chart shows system wide project counts, except confidential projects, depending on the user’s permission.
You can click on a bar to drill down to the project types and then to the list of projects that contribute to the bar.
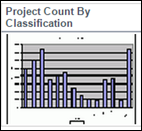
Project Count by Classification
The chart displays the number of projects that qualify the filter criteria on Y-Axis and the selected classification field on X-Axis. Projects that are aligned to multiple classification fields will be counted in multiple classifications.
You can click on a bar to drill down to the list of projects that contribute to the bar.
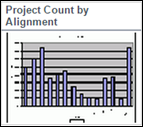
Project Count by Alignment
The chart displays the number of projects that qualify the filter criteria on Y-Axis and immediate children of selected Alignment node on X-Axis. This chart only works when the system has an Alignment (Strategy) configured. Projects that are aligned to multiple alignments will be counted in multiple alignments.
You can click on a bar to drill down to the list of projects that contribute to the bar.
Project Count by Phase
The chart displays the number of projects that qualify the filter criteria on Y-Axis and Phases on X-Axis. Within a phase, projects are grouped by their on-time status (On Schedule, Schedule At Risk and Behind Schedule). If one roadmap is selected in the filter, then the phases are displayed the order specified in the Roadmap. If multiple roadmaps are selected in the filter, then the Phases are displayed alphabetically.
User can click on a bar to drill down to the list of projects that contribute to the bar.
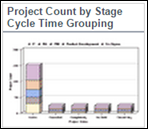
Project Count by Phase Cycle Time Grouping
The chart displays the number of Phases closed in the recommended phase duration (Red, Amber, and Green) for projects that qualify the filter criteria on Y-Axis and Phases X-Axis. If one roadmap is selected in the filter, then the phases are displayed in the order specified in the roadmap. If multiple roadmaps are selected in the filter, then the phases are displayed alphabetically.
You can click on a bar to drill down to the list of projects that contribute to the bar.
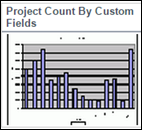
Project Count By Custom Field
The chart displays the number of projects that qualify the filter criteria on Y-axis and the selected custom field on X-axis. You can click on a bar to drill down to the list of projects.
Dashboard Component Properties
Component Name | Data Available for X-axis | Data Available for Y-axis | Category | Sub-Category | Default Drill Down | Supported Chart Type |
|---|---|---|---|---|---|---|
Project Count by Org | Organization | Project count | Project | Count | Project Listing Page | Bar |
Project Count by Period | Reporting period | Project count | Project | Count | Project Listing Page | Bar |
Project Count by Status | Current Project Status | Project count | Project | Count | Project Listing Page | Bar |
Project Count by Classification | Classification Field | Project count | Project | Count | Project Listing Page | Bar |
Project Count by Alignment | Alignment Node | Project count | Project | Count | Project Listing Page | Bar |
Project Count by Phase | Phases | Project count | Project | Count | Project Listing Page | Bar |
Project Count by Phase Cycle Time Grouping | Phases (closed in the recommended phase duration) | Project count | Project | Count | Project Listing Page | Bar |
Project Count by Custom Field | Custom Field | Project count | Project | Count | Project Listing Page | Bar |
See Also
Legal Notices
Copyright © 2000, 2016,
Oracle and/or its affiliates. All rights reserved.
Last Published Tuesday, June 21, 2016