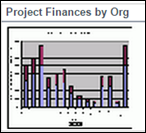
Project Finances by Org.
The chart displays the total for selected financial categories on Y-Axis for projects that qualify the filter criteria and Organization on X-Axis.
You can click on a bar to drill down to the list of projects that contribute to the bar. The chart can be displayed on different levels of the defined organization structure by the filter selection.
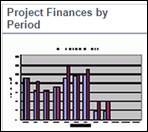
Project Finances by Period
The chart displays the realized vs. forecast finances on Y-Axis for projects that qualify the filter criteria and reporting period on X-Axis. Current quarter figures are as of the current date. Current year is displayed as YYYYYTD e.g. 2009YTD. YTD means Year to Date. Prior quarter and year-end figures are as of the last day of the period.
You can click on a bar to drill down to the list of projects that contribute to the bar. The Forecast is the total finances that are current for all projects in the system. The Realized (Actual) is the total finances that are locked for all projects in the system.
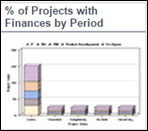
% of Projects with Finances by Period
The chart displays the percent of projects with financial benefits on Y-Axis for projects that qualify the filter criteria and reporting period on X-Axis. If more than one financial category is selected, then the percent of projects with benefits is calculated based on the sum of the selected financial categories. If a project contributes to more than one year, the project’s financial impact will be attributed to the corresponding reporting period. Current quarter figures are as of the current date. Current year is displayed as YYYYYTD e.g. 2009YTD. YTD means Year to Date. Prior quarter and year-end figures are as of the last day of the period.
You can click on a bar to drill down to the project types and then to the list of projects that contribute to the bar.
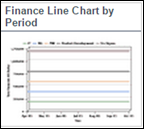
Finance Line Chart by Period
The chart displays Net Finances on Y-Axis for projects that qualify the filter criteria and reporting period on X-Axis.
You can click on a bar to drill down to the list of projects that contribute to the bar.
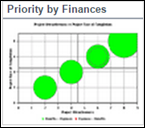
Priority by Finances
The chart displays the Risk or Priority on Y-Axis for the projects that qualify the filter criteria and Finances on X-Axis.
You can click on a bubble to drill down to the individual projects.
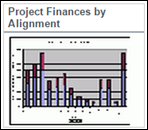
Project Finances by Alignment
The chart displays the sum of finances of projects that qualify the filter criteria on Y-Axis and immediate children of selected Alignment node on X-Axis. This chart only works when the system has an Alignment (Strategy) configured. Projects that are aligned to multiple alignments are counted in multiple alignments using specified percent allocation.
Click on a bar to drill down to the list of projects that contribute to the bar.
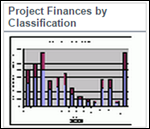
Project Finances by Classification
The chart displays the sum of finances of projects that qualify the filter criteria on Y-Axis and selected classification field on X-Axis. Projects that are aligned to multiple classification fields will be counted in multiple classifications.
You can click on a bar to drill down to the list of projects that contribute to the bar.
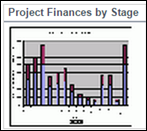
Project Finances by Phase
The chart displays the sum of finances of projects that qualify the filter criteria on Y-Axis and Phases X-Axis. If one Roadmap is selected in the filter, then the Phases are displayed the order specified in the Roadmap. If multiple Roadmaps are selected in the filter, then the Phases are displayed alphabetically.
You can click on a bar to drill down to the list of projects that contribute to the bar.
Project Finances by Custom Fields
The chart displays the sum of finances that qualify the filter criteria on Y-Axis and the selected classification field on X-Axis.
You can drill down to a list of projects that contribute to the bar.
Dashboard Component Properties
Component Name | Data Available for X-axis | Data Available for Y-axis | Category | Sub-Category | Default Drill Down | Supported Chart Type |
|---|---|---|---|---|---|---|
Project Finances by Org. | Organization | Total Finances | Project | Finances | Project Listing Report | Bar |
Project Finances by Period | Reporting Period | Total Finances | Project | Finances | Project Listing Report | Bar |
% of Projects with Finances by Period | Reporting Period | Total Finances | Project | Finances | Project Listing Report | Bar |
Finances Line Chart by Period | Reporting Period | Total Finances | Project | Finances | Project Listing Report | Bar |
Priority by Finances | Risk or Priority | Total Finances | Project | Finances | Project Listing Report | Bubble |
Priority by Alignment | Alignment Node | Total Finances | Project | Finances | Project Listing Report | Bubble |
Project Finances by Classification | Classification Fields | Total Finances | Project | Finances | Project Listing Report | Bubble |
Project Finances by Phase | Phase | Total Finances | Project | Finances | Project Listing Report | Bubble |
Project Finances by Custom Fields | Custom Field | Total Finances | Project | Finances | Project Listing Report | Bubble |
See Also
Legal Notices
Copyright © 2000, 2016,
Oracle and/or its affiliates. All rights reserved.
Last Published Tuesday, June 21, 2016