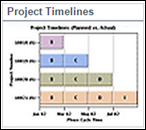
Project Timelines
The chart displays project timeline by phases for projects that qualify the filter criteria. If you use program as a filter, then all projects belonging to the selected Program are displayed. You can also select the display timeline (Actual and Plan, Actual, or Plan).
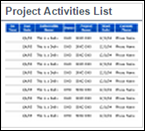
Project Activities List
The chart displays the list of activities assigned to any user. You can filter the list to view Open, Not Applicable, Completed activities, Non-WBS, WBS, milestone, and key milestone activities. You can click on a link to drill down to view Activity details.
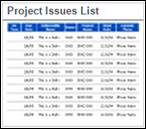
Project Issues List
The chart displays a list of project issues. You can filter to view issues that are not assigned to a resource. You can click on a link to drill down to view Issues details.
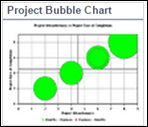
Project Bubble Chart
Displays a project bubble chart based on your filter criteria. You can customize the chart by selecting the parameters to display on the X axis and Y axis. You can also swap the X and Y axis parameters. Click on a link to drill down to view the Project Basics page.
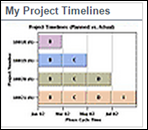
My Project Timelines
The chart displays project timeline by phases for projects that the user logged-in user is a team member on. The set of these associated projects is shown as a list and you can choose which ones to display.
The Actual and Plan timelines are displayed. This component is provided for backward compatibility. This component is deprecated for future use and the new Project Timelines component (above) should be used instead.
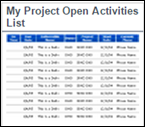
My Project Open Activities List
This component displays a list of open activities on the projects that the logged-in user is a team member on. There are no filters.
This component is provided for backward compatibility. This component is deprecated for future use and the new Project Activities List component (above) should be used instead.
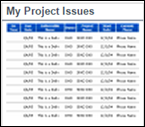
My Project Issues List
This component displays a list of issues on projects that the logged-in user is associated with. There are no filters.
This component is provided for backward compatibility. This component is deprecated for future use and the new Project Issues List component (above) should be used instead.
Dashboard Component Properties
Component Name | Data Available for X-axis | Data Available for Y-axis | Category | Sub-Category | Default Drill Down | Supported Chart Type |
|---|---|---|---|---|---|---|
Project Timelines | Gantt bars | Timeline | Project | General | Choose: Project Basics Gantt, Dates, status report | Gantt |
Project Activities List | Activities |
| Project | General | Project Roadmap Page | Table |
Project Issues List | Issues |
| Project | General | Project Edit Issue Page | Table |
My Project Timelines | Gantt bars | Timeline | Project | General | Project Basics Page | Gantt |
My Project Open Activities List | Activities |
| Project | General | Project Roadmap Page | Table |
My Project Open Issues List | Issues |
| Project | General | Project Edit Issue Page | Table |
Proposal Evaluation Criteria |
|
| Proposal |
| Measure List, Data and Chart | Bubble |
See Also
Legal Notices
Copyright © 2000, 2016,
Oracle and/or its affiliates. All rights reserved.
Last Published Tuesday, June 21, 2016