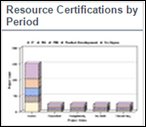
Resource Certifications by Period
The chart displays the user certification by certification type on Y-Axis for projects that qualify the filter criteria and reporting period on X-Axis. This chart shows information only when there is associated certification defined in the system. Current quarter figures are as of the current date. Current year is displayed as YYYYYTD. E.g. 2009YTD where YTD means Year to Date. Prior quarter and year-end figures are as of the last day of the period.
You can click on a bar to drill down to the list of resources that contribute to the bar.
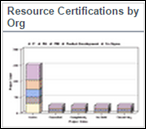
Resource Certifications by Org
The chart displays the number of certifications on Y-Axis for resources that qualify the filter criteria and organization on X-Axis. Current quarter figures are as of the current date. Current year is displayed as YYYYYTD. E.g. 2009YTD where YTD means Year to Date. Prior quarter and year-end figures are as of the last day of the period.
You can click on a bar to drill down to the list of projects that contribute to the bar.
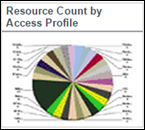
Resource Count by Access Profile
This pie chart displays a distribution of resources that qualify the filter criteria. Resources are grouped by access profile. Filters are available to select the resources based on the organization hierarchy and/or the status of the resource within the system.
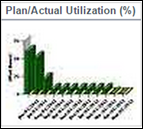
Resource Utilization Chart
The chart displays Heat map by resource. You can select multiple initiatives if more than one is configured. This chart is associated with the PMO module, and is available only if the PMO feature is enabled. Both plan and actual % are always displayed. You can configure the display for daily or monthly, and select the display mode to be either Percentage or Total.
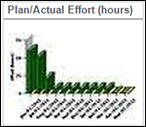
Project Effort Chart
The chart displays Heat map by project. This chart is associated with PMO module, thus if PMO feature is not used, this might not be available. Both plan and actual % are always displayed. Display can be configured for daily or monthly.
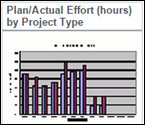
Project Effort Chart by Project Type, or by Project Methodology, or by Organization, or by Alignment, or by Classification
The chart displays Heat map by project. This chart is associated with PMO module, thus if PMO feature is not used, this might not be available. Both plan and actual hours are always displayed. Display can be configured for daily or monthly.
Dashboard Component Properties
Component Name | Data Available for X-axis | Data Available for Y-axis | Category | Sub-Category | Default Drill Down | Optional Drill Down | Supported Chart Type |
|---|---|---|---|---|---|---|---|
Resource Certifications by Period | Certifications | Date Range | Resources |
| Resource Professional Certification Report | Resource Listing Report | Bar |
Resource Certifications by Org | Certifications | Organization | Resources |
| Resource Professional Certification Report | Resource Listing Report | Bar |
Resource Count by Access Profile | Resource Count | Access Profile | Resources |
| Resource Listing Page | N/A | Pie |
Resource Utilization Chart | Calendar | % Utilization | Resources |
| Heat Map by Resource report |
| Bar |
Project Effort Chart | Calendar | Effort Hours | Resources |
| N/A |
| Bar |
Project Effort Chart by Project Type, or by Project Methodology, or by Organization, or by Alignment, or by Classification |
Project Type/ | Effort Hours | Resources |
| N/A |
| Bar |
See Also
Legal Notices
Copyright © 2000, 2016,
Oracle and/or its affiliates. All rights reserved.
Last Published Tuesday, June 21, 2016