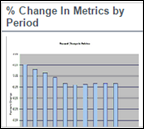
% Change In Metrics By Period
The chart displays the percent change in metrics on Y-Axis for projects that qualify the filter criteria and reporting period on X-Axis. The chart can report on either primary project metric or specific metric type. (One at a time.) Projects that start in one year and end in the next year will be counted in both years. Current quarter figures are as of the current date. Current year is displayed as YYYYYTD. E.g. 2009YTD where YTD means Year to Date. Prior quarter and year-end figures are as of the last day of the period.
You can click on a bar to drill down to the list of projects that contribute to the bar.
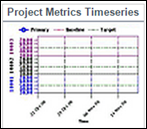
Project Metrics Timeseries
The chart displays Primary Metrics on Y-Axis for projects that qualify the filter criteria and reporting period on X-Axis for the projects that the current user is associated with.
System Administrator will not see any information when running this dashboard.
Dashboard Component Properties
Component Name | Data Available for X-axis | Data Available for Y-axis | Category | Sub-Category | Default Drill Down | Optional Drill Down | Supported Chart Type |
|---|---|---|---|---|---|---|---|
% Change In Metrics by Period | % of Metrics | Date Range | Project | Metrics | Project Listing Report |
|
|
Project Metrics Timeseries | Metric Value | Date Range | Project | Metrics |
| Project Basics Page | Line |
See Also
Legal Notices
Copyright © 2000, 2016,
Oracle and/or its affiliates. All rights reserved.
Last Published Tuesday, June 21, 2016