Link Performance Dashboard
Note: This dashboard is available only to users with the Email Analytics Manager role.
This shows top-performing link categories, along with a detailed tabular view of the performance of each link in a campaign. Learn more about setting up link tracking in the Email Message Designer.
This dashboard includes the following charts and table:
- Top Performing Links by Click-Through Rate Chart
- Top Performing Links by Conversion Rate Chart
- Top Performing Links by Revenue Chart
- Link Performance Table
To open the Link Performance dashboard:
- Click
 Insight on the side navigation bar, and select Interactive Dashboards.
 - Click Dashboards > Analytics.
- On the Analytics page, select the Email tab and expand Performance.
- Click Link.
Dimensions
A dimension is a data attribute used to categorize or filter a measure. A measure by itself has no meaning if presented without the context of a dimension.
Important: If you change a campaign’s name, folder, marketing program, marketing strategy, subject line, or external campaign ID, then historical and new launches for both triggered and standard launches will take these new values in Insight. It does not impact CED behavior as CED retains an unchanged ‘snapshot’ of values.
| Dimension | Definition |
|---|---|
| Link Category | Link category |
| Program | Name of the program |
| Campaign | Name of the campaign |
| Link Name | Link Name |
Measures
A measure is a numerical measurement representing the calculations gathered from your Oracle Responsys account and applied to your reports.
| Measure | Definition |
|---|---|
| Click-Through Rate | (Total Clicks / Delivered) * 100% Unsubscribes do not register as Clicks and therefore do not contribute to the calculation of Click-Through Rate, which is why a campaign's Click-Through Rate may be different from its Unsubscribe Rate. |
| Conversion Rate | (Conversions / Delivered) * 100% |
| Revenue | Total revenue associated with a particular campaign launch. Learn more about revenue tracking. |
| Unique Opens |
Number of unique email opens by a recipient. How Responsys counts unique email opens differs slightly between standard and triggered launches:
|
| Sent | Number of sent messages. |
| Bounce Rate | (Bounced / Sent) * 100% |
| Responders | Number of recipients (that is, unique individuals) who clicked on one or more links. Learn more about Link Tracking with the Email Message Designer. |
| Delivered Rate | (Delivered / Total Emails Sent) * 100% |
| Open Rate | (Opens / Delivered) * 100% |
| Open Rate (Adjusted) | (Opens / Delivered (Adjusted)) * 100%. Adjusted open rate to indicate performance of non-privacy protected mail clients. Learn more about the Open Rate(Adjusted) measure. |
| Unique Open Rate | (Unique Opens / Delivered) * 100% |
| Unique Click-Through Rate | (Unique Clicks / Delivered) * 100% |
| Responder Rate | (Responders / Delivered) * 100% |
| Unsubscribe Rate | (Unsubscribes / Delivered) * 100% Unsubscribes do not register as Clicks and therefore do not contribute to the calculation of Click-Through Rate, which is why a campaign's Click-Through Rate may be different from its Unsubscribe Rate. Learn more about setting up the default unsubscribe action for campaigns. |
| Revenue Per Email | (Total Revenue / Total Delivered) |
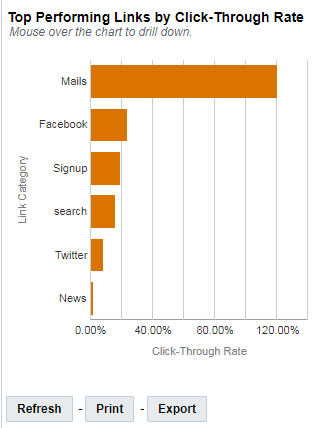
Top Performing Links by Click-Through Rate Chart
Top-performing link categories by Click-Through Rate. To analyze the links that are associated with a link category, click the link category to drill down to the detailed data.
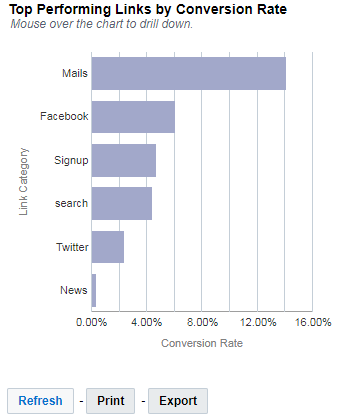
Top Performing Links by Conversion Rate Chart
Top-performing link categories by Conversion Rate. To analyze the links that are associated with a link category, click the link category to drill down to the detailed data.
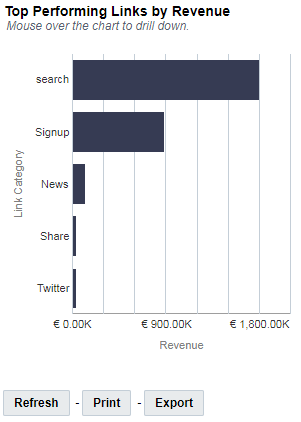
Top Performing Links by Revenue Chart
Top-performing link categories by Revenue. To analyze the links that are associated with a link category, click the link category to drill down to the detailed data.
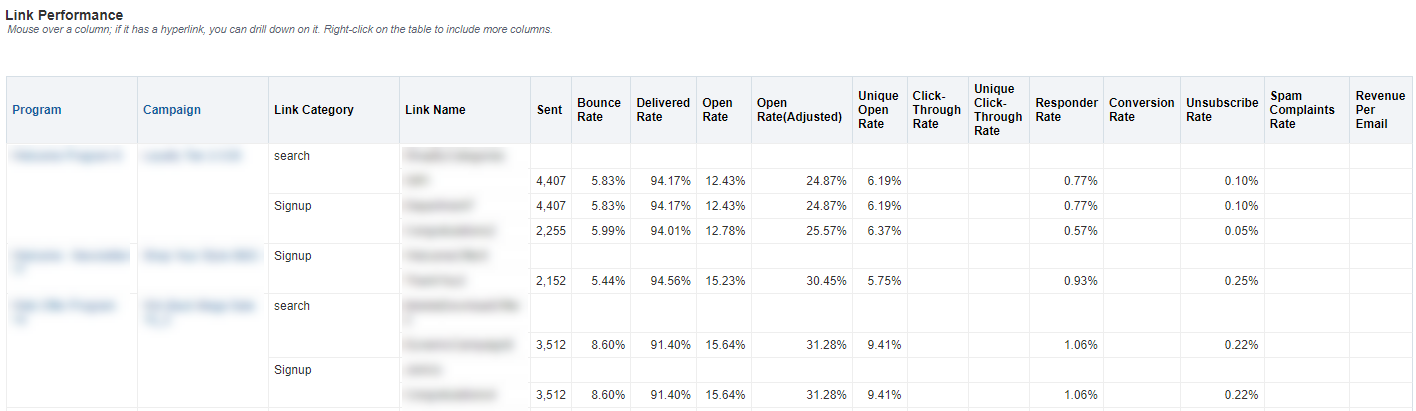
Link Performance Table
Provides a tabular view of the performance of each link in a campaign. You can drill down on Program and Campaign for a more detailed analysis.
- Dashboards Overview
- Using the Dashboards
- Measures for Email - Definitions
- Dimensions for Email - Definitions
- Custom Reports in Dashboards
- Emailing an Analysis from Interactive Dashboards