Graph Explorer User Interface
The Graph Explorer user interface lets you query property graphs in the database and graphs loaded into the graph server (PGX), and view results as either a graph visualization or a table.
The following shows the user interface for Graph Explorer:
Figure: Graph Explorer User Interface
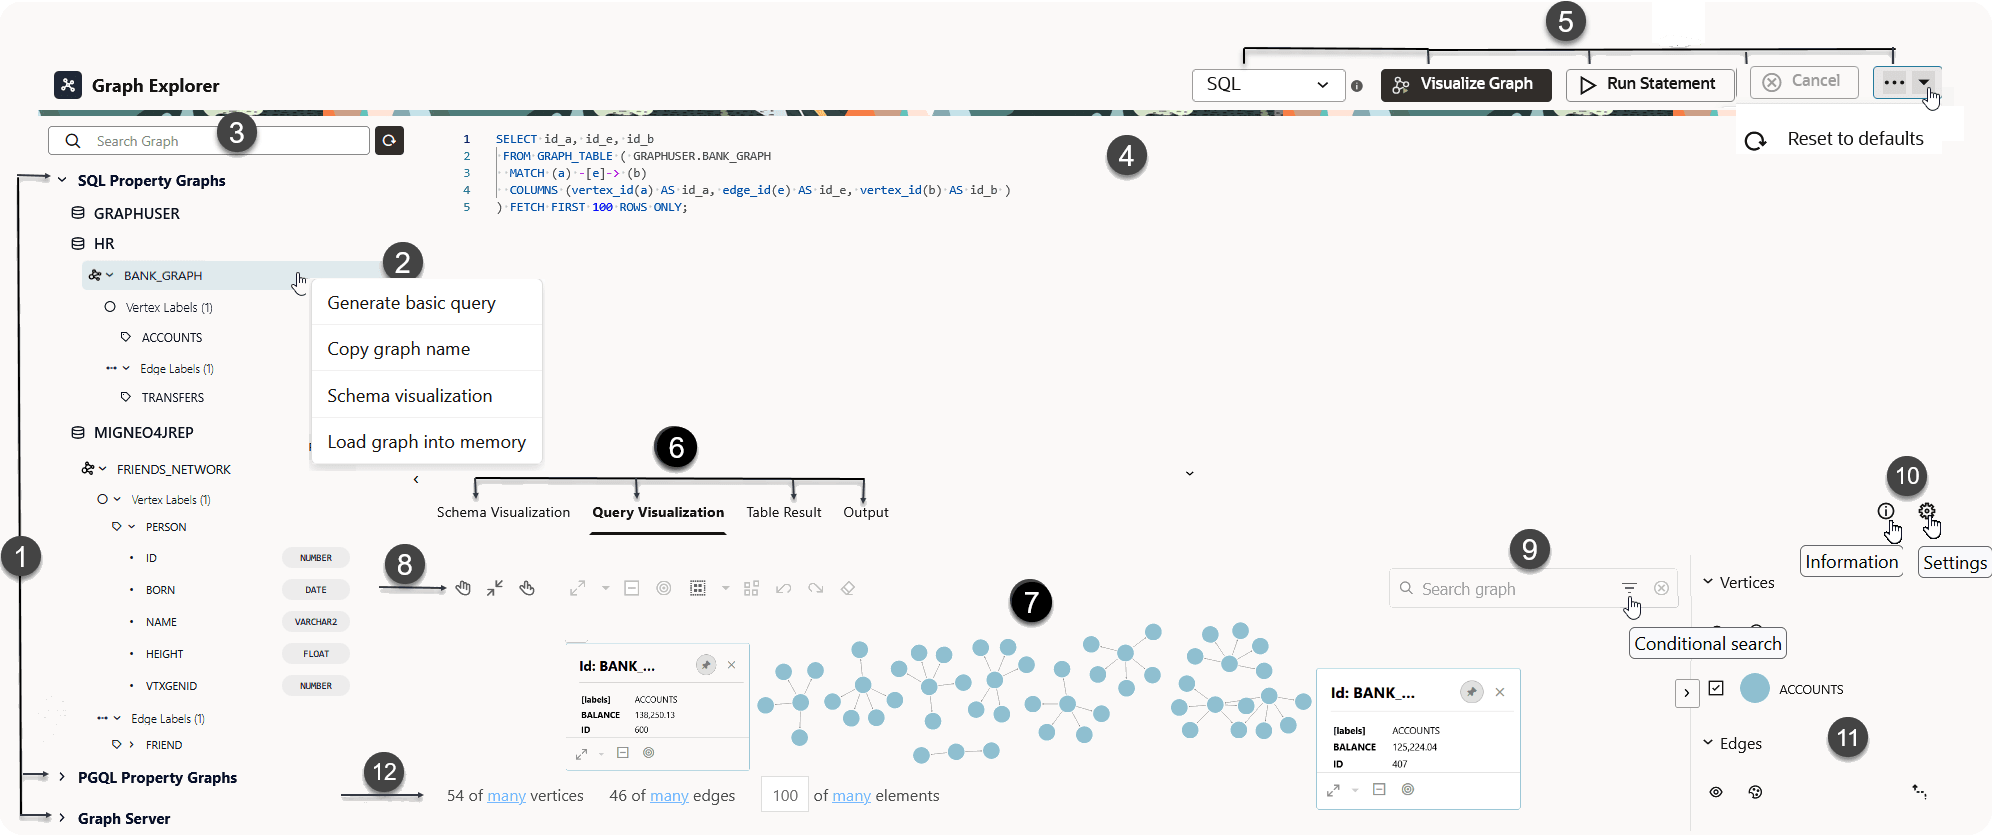
Description of the illustration graph_explorer_ui.png
-
Tree view: Displays all the available property graphs (to which you have access), grouped by type:
-
SQL Property Graphs (supported only on Oracle AI Database 26ai)
-
PGQL Property Graphs
-
Graph Server
Within each type, the graphs are grouped by database schema. Expand a graph to view its labels and expand a label to view its properties.
-
-
Context menu: Right-click on a specific graph to open a context menu.
The following options are supported for SQL property graphs:
-
Generate basic query: Generates a basic query for the selected SQL property graph.
-
Copy graph name: Copies the name of the selected SQL property graph.
-
Schema visualization: Opens the schema visualization for the selected SQL property graph.
See Visualizing the Schema of a SQL Property Graph in Graph Explorer for more information.
-
Load graph into memory: Loads the selected SQL property graph into graph server (PGX) memory.
See Loading or Unloading a Database Property Graph Into or From the Graph Server (PGX) Memory for more information.
The following options are supported for PGQL property graphs:
-
Generate basic query: Generates a basic query for the selected PGQL property graph.
-
Copy graph name: Copies the name of the selected PGQL property graph.
-
Schema visualization: Opens the schema visualization for the selected PGQL property graph.
See Visualizing the Schema of a PGQL Property Graph in Graph Explorer for more information.
-
Migrate to SQL graph: Migrates the selected PGQL property graph to a SQL property graph.
See Migrating PGQL Property Graphs to SQL Property Graphs for more information.
-
Load graph into memory: Loads the selected PGQL property graph into graph server (PGX) memory.
See Loading or Unloading a Database Property Graph Into or From the Graph Server (PGX) Memory for more information.
The following actions are supported for graphs loaded into the graph server (PGX) memory:
-
Generate basic query: Generates a basic query for the selected property graph.
-
Copy graph name: Copies the name of the selected property graph.
-
Schema visualization: Opens the schema visualization for the selected property graph.
-
Unload graph from memory: Unloads the selected property graph from graph server (PGX) memory.
See Loading or Unloading a Database Property Graph Into or From the Graph Server (PGX) Memory for more information.
-
-
Search: Use the search box to filter the list of available graphs in the tree view.
-
Query editor: Enter SQL graph queries, SQL statements, or PGQL graph queries.
If you used Generate Basic Query, you can edit the generated query or replace it with your own.
-
Query actions: An action panel at the top of the query editor to:
-
Driver selector: Select the driver for the query you are running.
-
SQL: Select to run SQL graph queries on SQL property graphs or to execute any SQL statements.
-
PGQL: Select to run PGQL queries on PGQL property graphs.
-
Graph Server: Select to run PGQL queries on graphs loaded into the graph server (PGX).
-
-
Visualize Graph: Click to run the latest query in the query editor and visualize the results.
-
Run Statement: Click to run the latest query and view the output in tabular format.
-
Cancel: Click to cancel an in-progress visualization query or a table-only query.
-
...: Click Reset to defaults in the actions menu to reset Graph Explorer to defaults.
-
-
Query result tabs: Displays the output in one of the following tabs:
-
Schema Visualization: Visualization of the underlying database schema for a property graph. See Visualizing the Schema of a SQL Property Graph in Graph Explorer and Visualizing the Schema of a PGQL Property Graph in Graph Explorer for more information.
-
Query Visualization: Graph visualization for:
-
SQL property graphs: See Example: Visualizing a SQL Property Graph Query.
-
PGQL property graphs: See Example: Querying a PGQL Property Graph.
-
Graph Server: See Example: Querying a PGQL Property Graph in the Graph Server (PGX).
-
-
Table Result: Tabular output for SQL statements, SQL graph queries, or PGQL graph queries. See Viewing Query Results in a Table for more information.
-
Output: Text output for statements such as
CREATE PROPERY GRAPH,INSERT,UPDATE,DELETE, orDROP PROPERTY GRAPHstatements. See Querying and Visualizing PGQL Property Graphs for examples.
-
-
Query visualization panel: The main canvas where graph query results are visualized.
You can right-click a vertex or an edge to open a property tooltip and view the properties associated with the selected graph element. Property tooltips can be pinned, repositioned, and resized to support comparison of multiple graph elements. See Viewing Vertex and Edge Properties for more information.
-
Graph visualization toolbar: Controls graph visualization modes and the different graph interaction options in the Query Visualization tab. See About the Graph Visualization Toolbar and Visualization Modes for more information.
-
Search: Search within the visualization results; includes support for keyword or conditional search. See Using Search in a Graph Visualization for more information.
-
Additional result controls:
-
Information: Shows the executed query (available in Query Visualization and Table Result tabs).
-
Settings: View and edit graph visualization settings in Query Visualization tab. See Query Visualization Settings for more information.
-
-
Legend panel: Displays legend items for the graph visualization. See About the Graph Visualization Legend Panel for more information.
-
Display size: Controls the display size of the graph. See Managing the Display Size of the Graph for more information.