
In addition to the OpenStack services, an OpenStack deployment requires several other components in order to operate, such as a database to store information and a message queue to coordinate operations and status information among services. These components are deployed as Docker containers on target nodes. This section describes some of the configuration options for these general components.
Oracle OpenStack for Oracle Linux uses Keepalived and HAProxy to provide high
availability and load balancing for the OpenStack service
endpoints. Keepalived and HAProxy are enabled by default
(controlled by the enable_haproxy property),
and they run on control nodes.
Keepalived manages the OpenStack internal and external virtual
IP (VIP) addresses. When you deploy OpenStack services, the
kernel on the OpenStack node is modified to enable its network
interfaces to bind to a non-local IP address
(net.ipv4.ip_nonlocal_bind=1). This enables
Keepalived to assign the VIP addresses to the network interfaces
on one of the control nodes. If the control node that manages
the VIP addresses fails, Keepalived automatically assigns the
VIP addresses to the network interfaces on another control node
(failover).
When the Docker service starts, the kernel on the OpenStack node
is modified to enable IP forwarding
(net.ipv4.ip_forward=1). HAProxy forwards
requests on the VIP addresses to the OpenStack service endpoints
on the internal management/API network. HAProxy also
load-balances the requests between the OpenStack nodes that run
the requested service.
See Section 4.6.1, “Configuring OpenStack Service Endpoints” for more details about internal and external VIP addresses.
Keepalived has a virtual router ID, which is used to manage the
virtual IP addresses. This ID must be unique to your OpenStack
deployment. If you have multiple OpenStack deployments on the
same management/API network or an external instance of
Keepalived on this network, you must configure a unique ID by
setting the keepalived_virtual_router_id
property. The default ID is 51. The ID is an
integer between 0 and 255.
Keepalived uses the Virtual Router Redundancy Protocol (VRRP) on
the internal management/API network to manage the VIP addresses.
VRRP communication between the Keepalived instances is protected
with password authentication. You configure the password
(keepalived_password) with either the
kollacli password set or the kollacli password init command. The
password is stored in the
/etc/kolla/passwords.yml file on the master
node.
HAProxy comes with a web interface for monitoring the load
balancer and the nodes that run HAProxy. The web interface is
available at
http://controller-node-IP-address:1984.
The port is configurable (the
haproxy_stats_port property). Access to the
web interface is protected by HTTP Basic Authentication
(configured in the HAProxy configuration). The default user name
is openstack (configurable with the
haproxy_user property). You configure the
password (haproxy_password) with either the
kollacli password set or the kollacli password init command. The
password is stored in the
/etc/kolla/passwords.yml file on the master
node.
Figure 4.5 shows an example of high availability for the Keystone public API endpoint. In this example, there are two control nodes with IP addresses 192.0.2.21 and 192.0.2.22 on the internal management/API network, and the Keystone public API port is port 5000 (the default). The internal and external VIP configuration is as follows:
kolla_external_vip_address: 203.0.113.10kolla_external_vip_interface: em3kolla_internal_vip_address: 192.0.2.100kolla_internal_vip_interface: em1
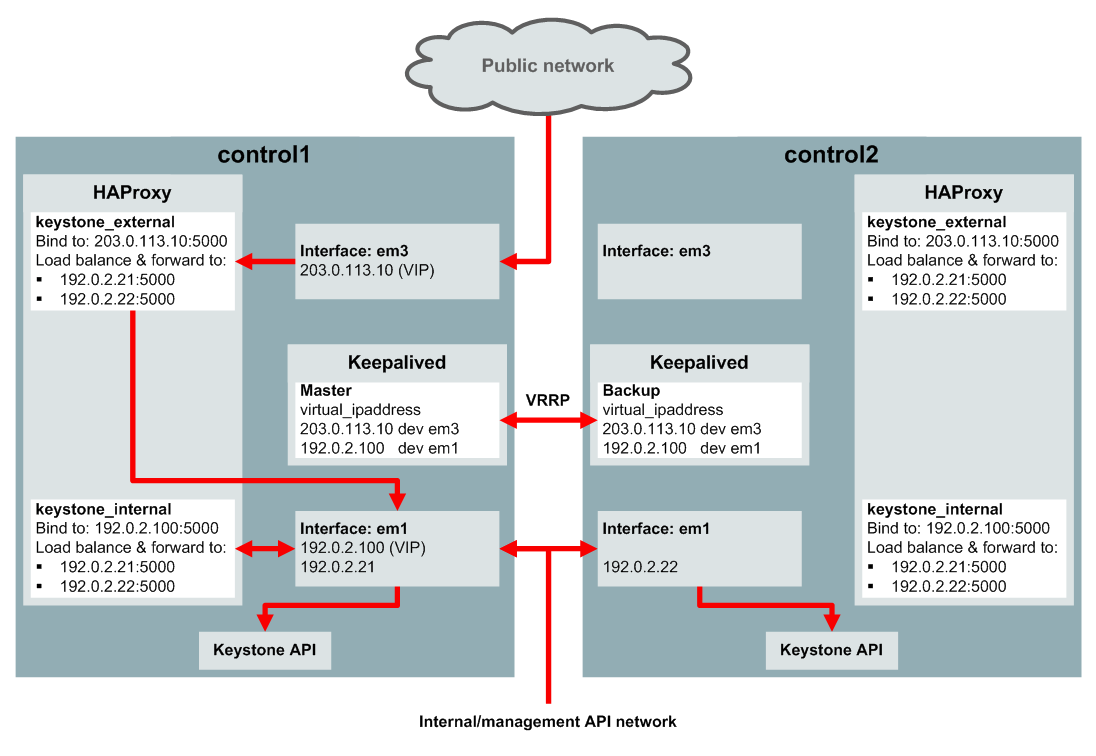
With this configuration, high availability for the Keystone public API is achieved as follows:
Keepalived on control1 acts as the master server, and Keepalived on control2 is the backup server. On control1, Keepalived assigns the 203.0.113.10 VIP address to the em3 network interface and assigns the 192.0.2.100 VIP address to the em1 network interface.
HAProxy on both control nodes is configured to bind to the 203.0.113.10:5000 address on the public network. Incoming requests to this address are handled by the HAProxy on control1. HAProxy load balances the request, and forwards it to the IP address of one of the control nodes on the internal management/API network on the em1 interface.
HAProxy on both control nodes is configured to bind to the 192.0.2.100:5000 address on the internal management/API network. Incoming requests to this address are handled by the HAProxy on control1. HAProxy load balances the request, and forwards it to the IP address of one of the control nodes on the internal management/API network on the em1 interface.
Keepalived uses the Virtual Router Redundancy Protocol (VRRP) on the em1 interface on the internal management/API network to provide high availability for the VIP addresses. The Keepalived backup server (control2) listens for regular VRRP multicast advertisement packets from the master server (control1). If the backup server fails to receive three advertisement packets, it takes over as the master server, and assigns the virtual IP addresses to its own network interfaces. The HAProxy on control2 now performs the load balancing and forwards the IP requests. If there were more than two control nodes, the Keepalived instance with the highest priority is elected as the new master.
Central logging consolidates and indexes the log files from the OpenStack Docker containers on all target nodes so that you can search the logs from a single location using a web browser. Central logging is enabled by default.
Central logging makes use of the following components, which run in Docker containers on target nodes:
Heka: This is an open source stream processing software system. Heka is used to process the OpenStack logs and forward the data to Elasticsearch.
Elasticsearch: This is a distributed, open source search and analytics engine. Elasticsearch is used to store and index the processed log files, and to provide full-text search capabilities.
Kibana: This is an open source data visualization platform. Kibana is used to search the OpenStack logs in Elasticsearch, and to create graphical representations of the data.
Heka is always deployed and it runs on every target node in the
deployment. All the log files that are processed by Heka are
collected on each target node in the
/var/lib/docker/volumes/kolla_logs/_data
directory. When central logging is enabled, Elasticsearch and
Kibana run on the controller nodes.
Kibana has a web interface where you can search the logs, and
create graphics and dashboards. The web interface is available
at http://kibana-address:5601, where
kibana-address is the internal or
external virtual IP (VIP) address, or the internal or external
fully qualified DNS name, used for your OpenStack deployment.
See Section 4.6.1, “Configuring OpenStack Service Endpoints” for more details
about VIP addresses and DNS names. The port is configurable (the
kibana_port property).
Access to the kibana web interface is protected by HTTP Basic
Authentication (configured in the HAProxy configuration). The
default user name is kibana (configurable
with the kibana_user property). You configure
the password (kibana_password) with either
the kollacli password set or the kollacli password init command. The
password is stored in the
/etc/kolla/passwords.yml file on the master
node.
To disable central logging before you deploy OpenStack:
$ kollacli property set enable_central_logging no
If you disable central logging, you can examine the log files on
each target node in the
/var/lib/docker/volumes/kolla_logs/_data
directory. You can also collect the log files from the target
nodes, as described in
Section 8.4, “Collecting the Log Files”).
After you have deployed OpenStack services with enabled central logging, you need to configure the Elasticsearch index pattern in the Kibana web interface so that you can search and view the logs, and create data visualizations. You do this as follows:
In a web browser, go to http://
kibana-address:5601.where
kibana-addressis the internal or external virtual IP (VIP) address, or the internal or external fully qualified DNS name, used for your OpenStack deployment. See Section 4.6.1, “Configuring OpenStack Service Endpoints” for more details about VIP addresses and DNS names.Kibana supports most modern web browsers. See https://www.elastic.co/support/matrix#show_browsers for details of the supported browsers for Kibana version 4.
When prompted, log in with the Kibana user name and password.
Once you are logged in, you are automatically prompted to configure an index pattern.
Configure an index pattern.
The following is the recommended index pattern to configure:
Select Index contains time-based events.
Ensure Use event times to create index names [DEPRECATED] is deselected.
In the Index name or pattern box, enter
log-*.Ensure Do not expand index pattern when searching (Not recommended) is deselected.
In the Time-field name list, select .
Click Create to create the index.
The Kibana web interface is not shipped with any preconfigured searches, visualizations or dashboards for use with OpenStack. You might want to configure these for use in your deployment, as follows:
The tab enables you to search the logs, filter the results on the available log fields, and view matching individual log entries.
The tab enables you to create a variety of charts based on searches of the logs.
The tab enables you to create dashboards that use your saved searches and visualizations.
In the Kibana web interface, the time period filter you select in the top right-hand corner controls the amount of data shown in any searches, visualizations, or dashboards.
You can save searches, visualizations, and dashboards so that they can be used again in another Kibana session. You can also export them so that they can imported for use in another OpenStack deployment (select the Settings tab and then the Objects tab) .
For more detailed information, see the Kibana User Guide at https://www.elastic.co/guide/en/kibana/current/index.html.