This report is a combination chart showing net sales and discounts as bars, and a line that represents the number of orders received. Place the cursor over a data point to show the exact values for that point.
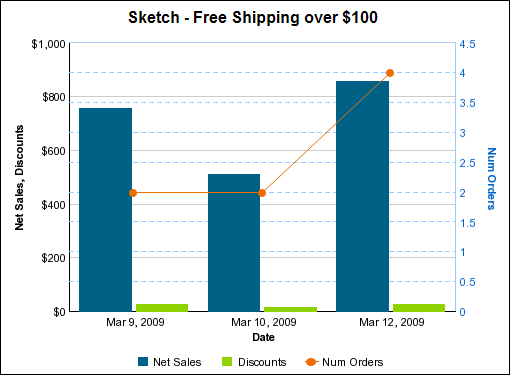
Below the chart, a table shows the data values for the following:
Promotion Name
Period
Net Sales
Discounts
Num Orders
