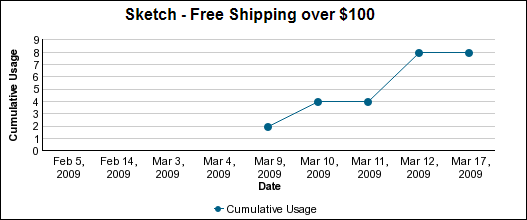
This report is a line chart showing cumulative promotion use each day. Hover the cursor over a data point on the line to show the values for that point.
Below the chart, a table shows the data values for the following:
Date
Usage per Day
Cumulative Usage