This report displays a table showing the best-performing categories for each of your segments. The example shown includes ten categories, ranked by Units.
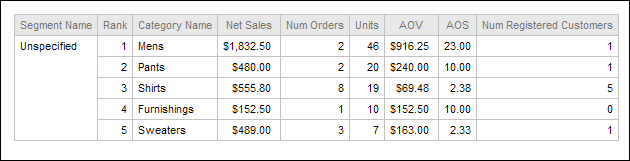
For each segment, the report includes the following data:
Rank
Category Name
Net Sales
Num Orders
Units
AOV—Average Order Value
AOS—Average Order Size, number of items
Num Registered Customers—Number of customers in this segment who had activity in this category
Note that this report uses Olympic ranking; if two categories are tied, they are assigned the same rank. You can change the ranking criterion and the number of categories to show after the report displays.
