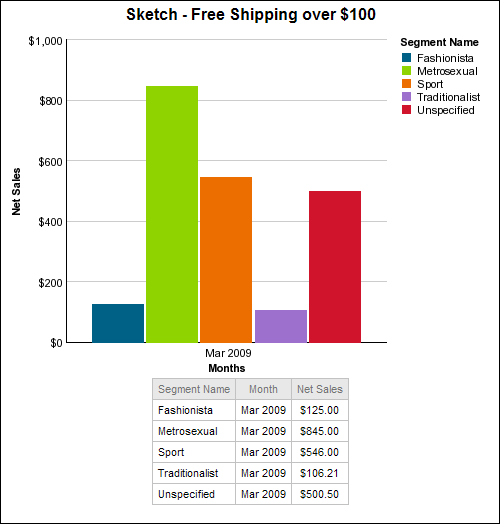
This chart shows net sales for the promotion, broken down by segment. Hovering on a data point on the line shows the values for that point.
Below the chart, a table shows the data values for the following:
Segment Name
Month
Net Sales