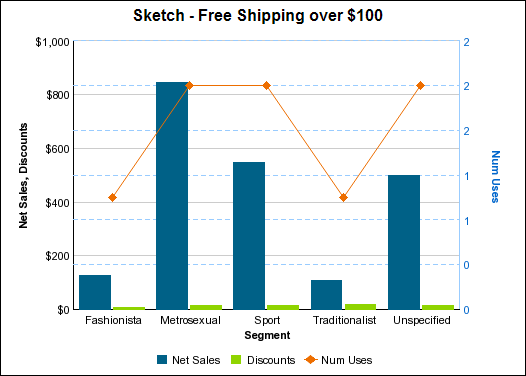
This report is a combination chart showing net sales and discounts as bars, and a line that represents the number of times the promotion was used.
Below the chart, a table shows the data values for the following:
Promotion Name
Segment Name
Order Amount
Discounts
Num Uses