The software described in this documentation is either in Extended Support or Sustaining Support. See https://www.oracle.com/us/support/library/enterprise-linux-support-policies-069172.pdf for more information.
Oracle recommends that you upgrade the software described by this documentation as soon as possible.
When you use the dtrace command, you invoke the compiler for the D language. Once DTrace has compiled your program, it sends it to the operating system kernel for execution, where it activates the probes that your program uses.
DTrace enables probes only when you are using them. No instrumented code is present for inactive probes, so your system does not experience performance degradation when you are not using DTrace. Once your D program exits, all of the probes it used are automatically disabled and their instrumentation is removed, returning your system to its original state. No effective difference exists between a system where DTrace is not active and one where the DTrace software is not installed.
DTrace implements the instrumentation for each probe dynamically on the live, running operating system. DTrace neither quiesces nor pauses the system in any way, and it adds instrumentation code only for the probes that you enable. As a result, the effect of using DTrace probes is limited to exactly what you ask DTrace to do. DTrace instrumentation is designed to be as efficient as possible, and enables you to use it in production to solve real problems in real time.
The DTrace framework provides support for an arbitrary number of virtual clients. You can run as many simultaneous D programs as you like, limited only by your system's memory capacity, and all the programs operate independently using the same underlying instrumentation. This same capability also permits any number of distinct users on the system to take advantage of DTrace simultaneously on the same system without interfering with one another.
Unlike a C or C++ program, but similar to a Java program, DTrace compiles your D program into a safe intermediate form that it executes when a probe fires. DTrace validates whether this intermediate form can run safely, reporting any run-time errors that might occur during the execution of your D program, such as dividing by zero or dereferencing invalid memory. As a result, you cannot construct an unsafe D program. You can use DTrace in a production environment without worrying about crashing or corrupting your system. If you make a programming mistake, DTrace disables the instrumentation and reports the error to you.
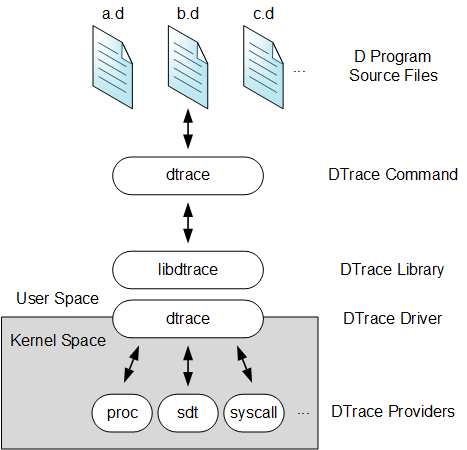
Figure 11.1 illustrates the different components of the DTrace architecture, including probe providers, the DTrace driver, the DTrace library, and the dtrace command.


