Deliverability Trends Dashboard
Note: This dashboard is available only to users with the Email Analytics Manager role.
This dashboard provides an at-a-glance summary of the deliverability metrics of the email channel. The dashboard helps you analyze trends in deliverability over time and provides a summary of top bounce categories and top performing ISPs. Learn more about analyzing deliverability in the Email Message Designer.
This dashboard includes the following charts and table:
- Deliverability Trend Chart
- Top Bounce Categories by Bounce Type Chart
- Top ISPs by Send Volume Chart
- Deliverability by Campaign Table
To open the Deliverability Trends dashboard:
- Click
 Insight on the side navigation bar, and select Interactive Dashboards.
 - Click Dashboards > Analytics.
- On the Analytics page, select the Email tab and expand Performance.
- Click Deliverability Trends.
To see more reports:
- Click
 View More Reports to see the:
Dimensions
A dimension is a data attribute used to categorize or filter a measure. A measure by itself has no meaning if presented without the context of a dimension.
Important: If you change a campaign’s name, folder, marketing program, marketing strategy, subject line, or external campaign ID, then historical and new launches for both triggered and standard launches will take these new values in Insight. It does not impact CED behavior as CED retains an unchanged ‘snapshot’ of values.
| Dimension | Definition |
|---|---|
| Sent Date | Day corresponding to the sent date |
| Bounce Type | Soft or Hard Bounce. Learn more about bounced emails. |
| Bounce Category | Bounce Category |
| Bounce Reason | Bounce Reason, which can be Likely Bad Address - Hard, Likely Bad Address - Soft, Possible Block, MailBox Full or Related, Undetermined – Hard, or Undetermined - Soft. |
| ISP | ISP |
| Region | Region |
| Campaign | Name of the campaign |
| Subject Line | Subject line of the email message |
| IP Address | IP Address |
Measures
A measure is a numerical measurement representing the calculations gathered from your Oracle Responsys account and applied to your reports.
| Measure | Definition |
|---|---|
| Sent | Number of sent messages. |
| Delivered | Number of successfully delivered messages (that is, Sent minus Bounced) |
| Bounced | Number of unique bounced email addresses. Can be broken down by Bounce Reasons: Likely Bad Address - Hard; Likely Bad Address - Soft; Possible Block; MailBox Full or Related; Undetermined – Hard; Undetermined - Soft. Learn more about bounces. |
| Hard Bounce Rate | (Hard Bounces / Sent) * 100% |
| Bounce Rate | (Bounced / Sent) * 100% |
| Soft Bounce Rate | (Soft Bounces / Sent) * 100% |
| Delivered Rate | (Delivered / Total Emails Sent) * 100% |
| Click-Through Rate | (Total Clicks / Delivered) * 100% Unsubscribes do not register as Clicks and therefore do not contribute to the calculation of Click-Through Rate, which is why a campaign's Click-Through Rate may be different from its Unsubscribe Rate. |
| Spam Complaints Rate | (Total Spam Complaints / Delivered) * 100% |
| Open Rate | (Opens / Delivered) * 100% |
| Soft Bounces | Number of emails classified as soft bounces (that is, emails that are not deliverable, but might become deliverable if retried in the future). Retries on soft bounces by mail transfer agents (MTAs) are not recorded as additional sends. However, the soft bounces metrics does include the additional soft bounces that may result from the retries. |
| Click Per Responder | (Total Clicks / Responders) |
| Unique Opens |
Number of unique email opens by a recipient. How Responsys counts unique email opens differs slightly between standard and triggered launches:
|
| Unique Open Rate | (Unique Opens / Delivered) * 100% |
| Unique Clicks |
Number of unique clicks on a link in a message by a responder. How Responsys counts unique clicks differs slightly between standard and triggered launches:
|
| Unique Click-Through Rate | (Unique Clicks / Delivered) * 100% |
| Unsubscribes | Count of unsubscribes. Unsubscribes do not register as Clicks. Learn more about setting up the default unsubscribe action for campaigns. |
| Unsubscribe Rate | (Unsubscribes / Delivered) * 100% Unsubscribes do not register as Clicks and therefore do not contribute to the calculation of Click-Through Rate, which is why a campaign's Click-Through Rate may be different from its Unsubscribe Rate. Learn more about setting up the default unsubscribe action for campaigns. |
| Spam Complaints | Number of all spam complaints as reported to Responsys by the ISPs. Only spam complaints from specific ISPs are considered in this metric. |
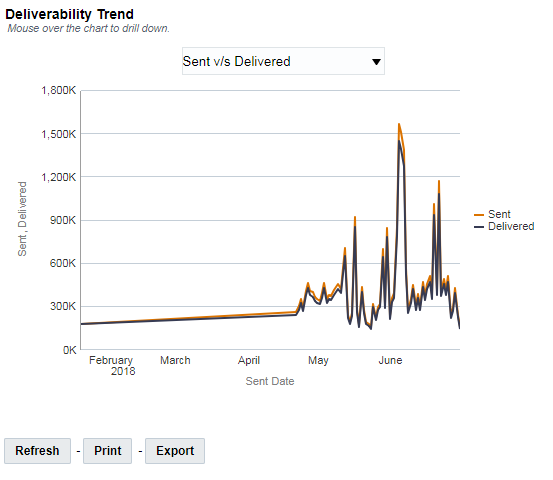
Deliverability Trend Chart
Shows deliverability trends. The performance metrics can be plotted against each other for a comparison over time. To do this, select the comparison from the drop down list.
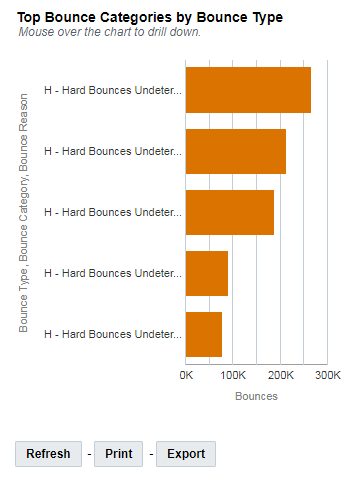
Top Bounce Categories by Bounce Type Chart
Shows a summary of top bounce categories. You can analyze the top Bounce categories by Bounce Type and drill down to the bounce reason.
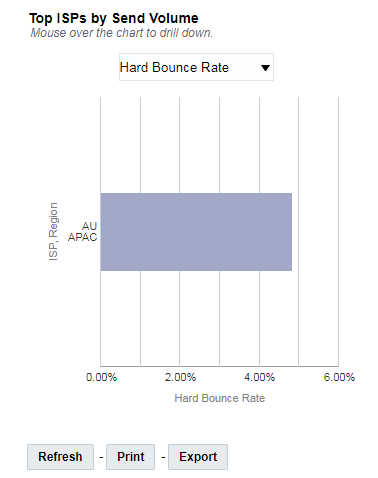
Top ISPs by Send Volume Chart
Shows a summary of top-performing ISPs. You can analyze the top ISPs by deliverability metrics such as Bounce Rate and drill down to the region and domain name.
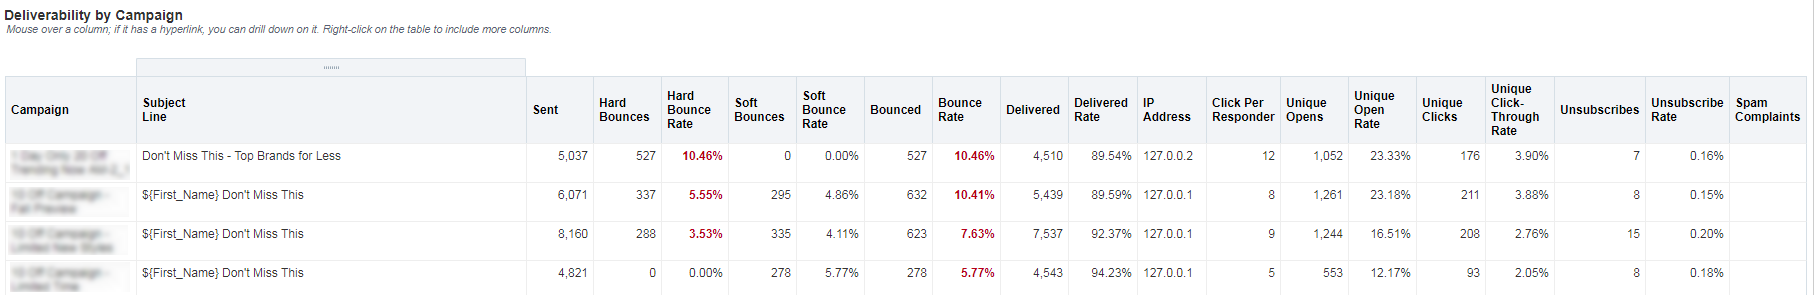
Deliverability by Campaign Table
Provides a tabular view of deliverability for the email channel. For a more detailed analysis, you can drill down on Program, Campaign, Region, and ISP.