Device Performance Dashboard
Note: This dashboard is available only to users with the Email Analytics Manager role.
The Device dashboard helps you analyze the performance of various devices and browsers used to respond to email campaigns over time.
The performance metrics include:
- Opens
- Clicks
- Conversions
The charts show device and browser performance trends, sending trends, and the top browsers (such as mobile or desktop browser) and operating systems. If you are using the Oracle Responsys Mobile App Platform Cloud Service, you can see conversions by mobile app as well.
You can compare the performance metrics of device and browser trend charts against the sending trend chart to correlate upward or downward spikes on Opens, Clicks, or Conversions against the send volume.
This dashboard includes the following charts and table:
- Device Types Chart
- Top Browsers Chart
- Top Operating Systems Chart
- Browser Types Chart
- OS Vendors Chart
- Device Performance Table
To open the Device Performance dashboard:
- Click
 Insight on the side navigation bar, and select Interactive Dashboards.
 - Click Dashboards > Analytics.
- On the Analytics page, select the Email tab and expand Performance.
- Click Device.
- You can switch between three views of the data: By Month, Overall, and Table. To switch between views, select the view you want then click Apply.
- You can change the metrics displayed for each chart.
Dimensions
Note: As of 18C, Responsys has moved to a new device data framework that allows us to detect a large number of devices and their attributes with improved accuracy. The values of various device attributes now display differently than legacy device attributes.
A dimension is a data attribute used to categorize or filter a measure. A measure by itself has no meaning if presented without the context of a dimension.
| Dimension | Definition |
|---|---|
| Sent Month | Month corresponding to the sent date |
| Sent Date | |
| Device Type | Type of device used to respond to the message, for example Mobile, Desktop, or Tablet |
| Browser | Name of the browser used to respond to the message, such as Chrome, Firefox |
| Operating System | Operating system of the device, for example Android, or iOS |
| Browser Type | Type of the browser used to respond to the message. for example Email Client, Mobile Browser |
| OS Vendor | Vendor of the device's operating system, for example Google or Microsoft |
Measures
A measure is a numerical measurement representing the calculations gathered from your Oracle Responsys account and applied to your reports.
| Measure | Definition |
|---|---|
| Clicks | Count of total clicks; that is, clicks on all links, including multiple clicks on the same link(s). Unsubscribes do not register as Clicks. |
| Opens | Number of email messages opened, including multiple opens, except Auto Opens. Learn more about tracking opens. |
| Conversions | Number of conversion actions. Learn more about conversion tracking here. |
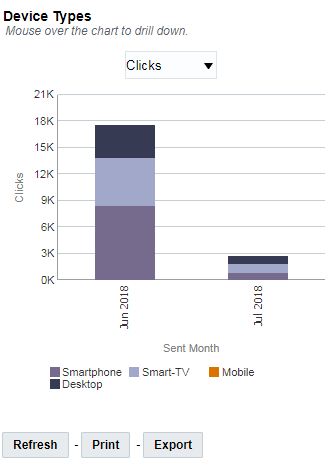
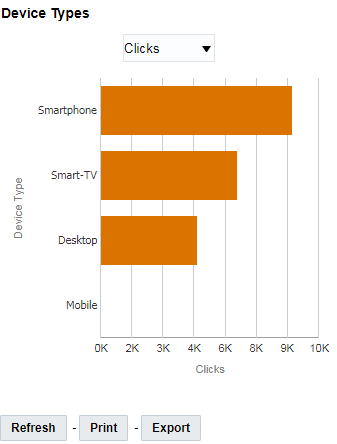
Device Types Chart
Trends the performance of various devices. Use the drop-down menu to switch between measures: Clicks, Opens, or Conversions. At the top of the dashboard, switch between a monthly, an overall, and a tabular view. Click on a device type in the monthly view to see a more detailed analysis.
You can now use the new Device Type value "Robot" to filter out bot clicks from the Device performance dashboard displayed in Insight Interactive Dashboards.
Oracle Responsys determines which clicks are bot clicks (that is, Device Type is "Robot") by analyzing user agent strings and other data elements. Responsys uses an underlying library that is frequently updated to identify clicks that are not from a human source.

To filter out bot clicks: Using the Device Type filter, select all options except Robot, and then click Apply. The dashboard will filter out all results where the Device Type is "Robot".
Note: Historical data before the Responsys 21C Update does not reflect the "Robot" device type.
Filtering out bot clicks helps you view a more accurate analysis of the performance of various devices and browsers used to respond to email campaigns over time.
By Month
Overall
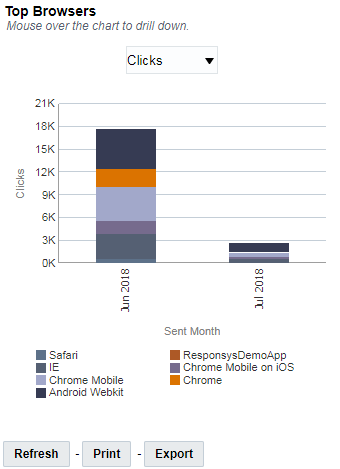
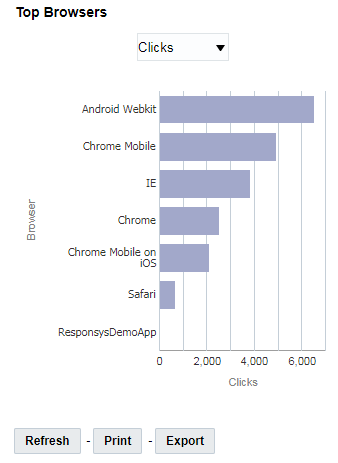
Top Browsers Chart
Shows the top browsers. Use the drop-down menu to switch between measures: Clicks, Opens, or Conversions. At the top of the dashboard, switch between a monthly, an overall, and a tabular view. Click on a browser in the monthly view to see a more detailed analysis.
By Month
Overall
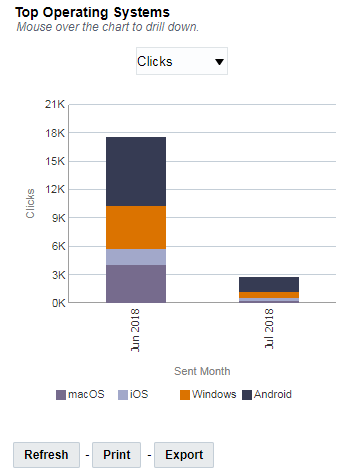
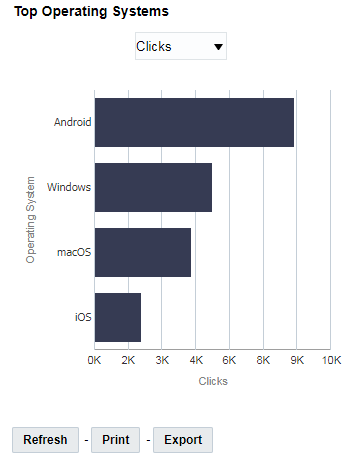
Top Operating Systems Chart
Shows the top operating systems. Use the drop-down menu to switch between measures: Clicks, Opens, or Conversions. At the top of the dashboard, switch between a monthly, an overall, and a tabular view. Click on an operating system in the monthly view to see a more detailed analysis.
By Month
Overall
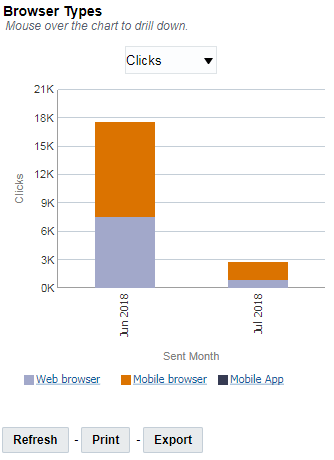
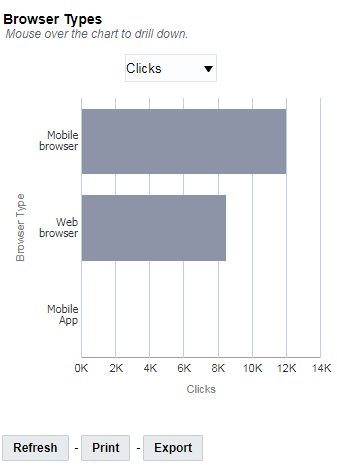
Browser Types Chart
Trends the performance of various browsers. Use the drop-down menu to switch between measures: Clicks, Opens, or Conversions. Click on a browser type in the monthly view to see a more detailed analysis.
By Month
Overall
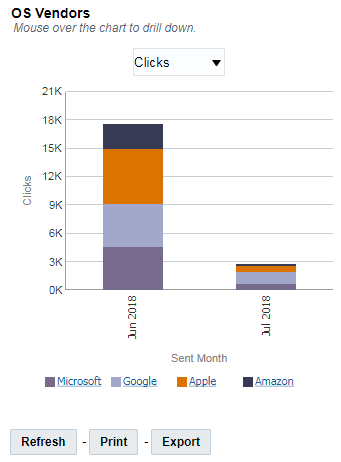
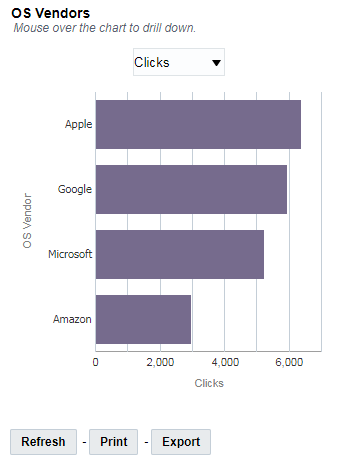
OS Vendors Chart
Trends the performance of various OS systems. Use the drop-down menu to switch between measures: Clicks, Opens, or Conversions. At the top of the dashboard, switch between a monthly, an overall, and a tabular view. Click on an OS vendor in the monthly view to see a more detailed analysis.
By Month
Overall
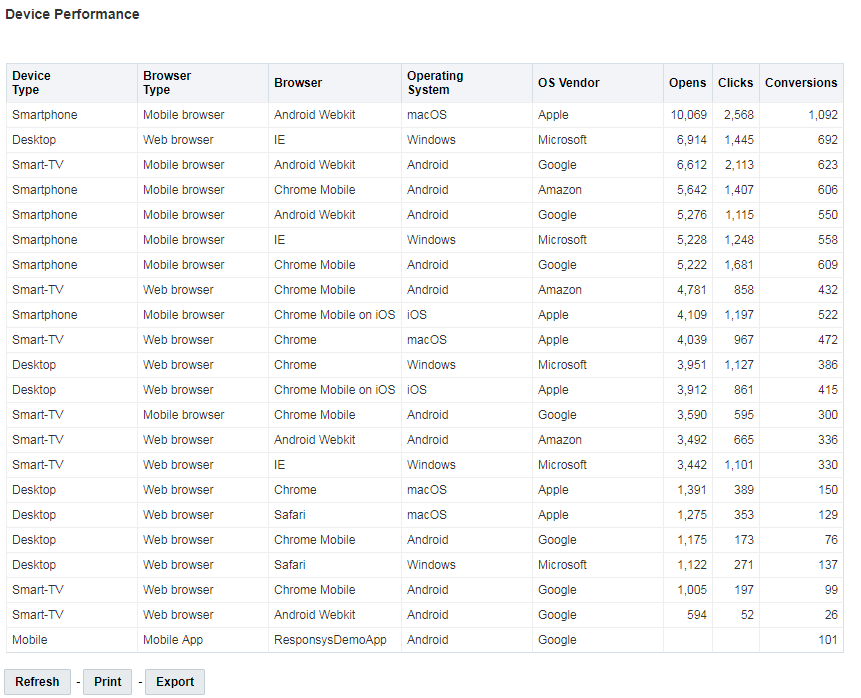
Device Performance Table
Provides a tabular view of device performance metrics by campaign. Select a Program or Campaign for a more detailed analysis. At the top of the dashboard, switch between a monthly, an overall, and a tabular view.