Email Campaign Analysis Dashboard
Note: This dashboard is available only to users with the Email Analytics Manager role.
This dashboard helps you analyze the key performance metrics of a selected campaign, and to trend the responses to the campaign over the number of days after the send. The dashboard also shows which devices recipients use for the campaign. Get an overview of campaigns here.
This dashboard includes the following charts and table:
To open the Email Campaign Analysis dashboard:
- Click
 Insight on the side navigation bar, and select Interactive Dashboards.
 - Click Dashboards > Analytics.
- On the Analytics page, select the Email tab, expand Performance, and select Campaign.
The Campaign Performance report opens.
-
Click
 of the campaign you want to analyze.
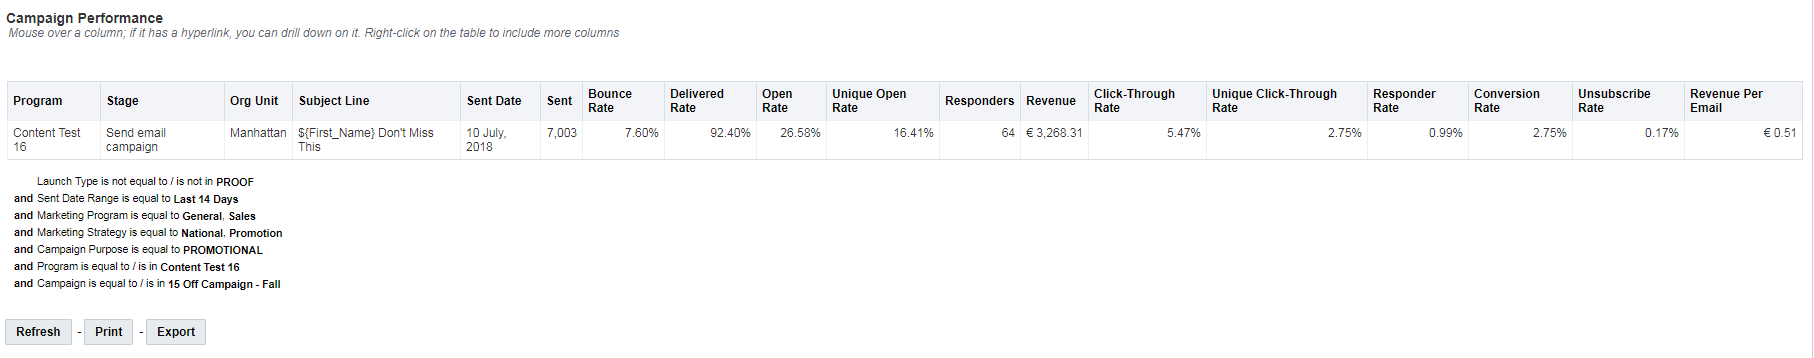
Summary of Key Performance Metrics
The dashboard provides a quick overview of the following key performance metrics for campaign:
- Sent - Number of sent messages.
- Delivered Rate - (Delivered / Total Emails Sent) * 100%
- Unique Open Rate - (Unique Opens / Delivered) * 100%
- Unique Click-Through Rate - (Unique Clicks / Delivered) * 100%
- Unique Conversion Rate - (Unique Conversions / Delivered) * 100%
- Unsubscribe Rate - (Unsubscribes / Delivered) * 100%
Unsubscribes do not register as Clicks and therefore do not contribute to the calculation of Click-Through Rate, which is why a campaign's Click-Through Rate may be different from its Unsubscribe Rate. Learn more about setting up the default unsubscribe action for campaigns. - Revenue Per 1K Email - (Total Revenue / Total Delivered) * 1000
Dimensions
A dimension is a data attribute used to categorize or filter a measure. A measure by itself has no meaning if presented without the context of a dimension.
Important: If you change a campaign’s name, folder, marketing program, marketing strategy, subject line, or external campaign ID, then historical and new launches for both triggered and standard launches will take these new values in Insight. It does not impact CED behavior as CED retains an unchanged ‘snapshot’ of values.
Measures
A measure is a numerical measurement representing the calculations gathered from your Oracle Responsys account and applied to your reports.
| Measure | Definition |
|---|---|
| Click-Through Rate | (Total Clicks / Delivered) * 100% Unsubscribes do not register as Clicks and therefore do not contribute to the calculation of Click-Through Rate, which is why a campaign's Click-Through Rate may be different from its Unsubscribe Rate. |
| Unique Click-Through Rate | (Unique Clicks / Delivered) * 100% |
| Delivered Rate | (Delivered / Total Emails Sent) * 100% |
| Open Rate | (Opens / Delivered) * 100% |
| Unique Open Rate | (Unique Opens / Delivered) * 100% |
| Conversion Rate | (Conversions / Delivered) * 100% |
| Unique Conversion Rate | (Unique Conversions / Delivered) * 100% |
| Unsubscribe Rate | (Unsubscribes / Delivered) * 100% Unsubscribes do not register as Clicks and therefore do not contribute to the calculation of Click-Through Rate, which is why a campaign's Click-Through Rate may be different from its Unsubscribe Rate. Learn more about setting up the default unsubscribe action for campaigns. |
| Revenue Per Email | (Total Revenue / Total Delivered) |
| Clicks | Count of total clicks; that is, clicks on all links, including multiple clicks on the same link(s). Unsubscribes do not register as Clicks. |
| Opens | Number of email messages opened, including multiple opens, except Auto Opens. Learn more about tracking opens. |
| Conversions | Number of conversion actions. Learn more about conversion tracking here. |
| Sent | Number of sent messages. |
| Bounce Rate | (Bounced / Sent) * 100% |
| Responders | Number of recipients (that is, unique individuals) who clicked on one or more links. Learn more about Link Tracking with the Email Message Designer. |
| Revenue | Total revenue associated with a particular campaign launch. Learn more about revenue tracking. |
| Responder Rate | (Responders / Delivered) * 100% |
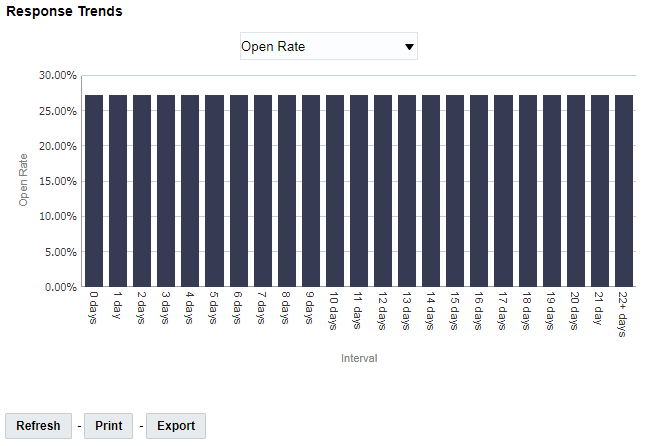
Response Trends Chart
This chart trends its measures over a number of days after the campaign was sent.
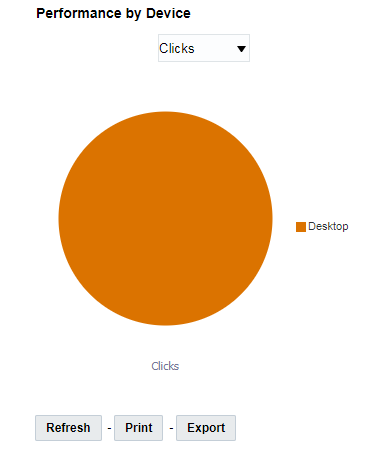
Performance by Device Chart
This chart shows the Clicks, Opens, and Conversions broken down by device type.
Campaign Performance Table
This report provides granular analysis of the campaign.