Using SuiteAnalytics Workbook
SuiteAnalytics Workbook is an analytical tool available in NetSuite. With Workbook, you can create and fully customize workbooks that combine datasets, tables, pivot tables, and charts using a single tool that leverages the new analytics data source.
By default, the SuiteAnalytics Workbook feature is enabled in all NetSuite accounts. If you can't find the Analytics tab in the NetSuite navigation menu, contact a user with the Administrator role.
See the following sections for information about workbooks and datasets, and workbook and dataset templates:
Navigation
Watch the following help video for information about navigating the SuiteAnalytics Workbook user interface:
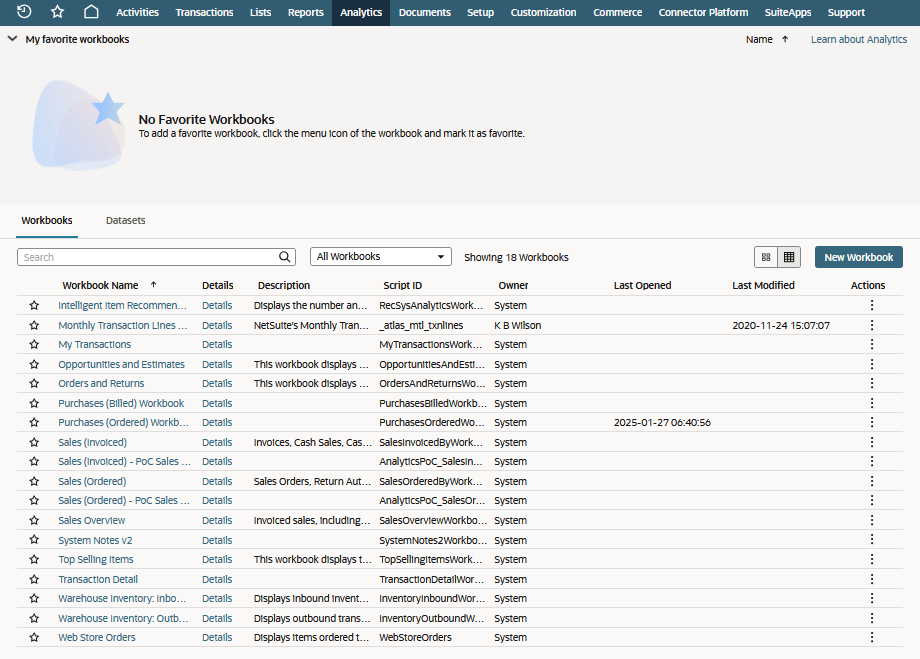
To access SuiteAnalytics Workbook, click the Analytics tab in NetSuite. The Workbook user interface includes the Analytics Home page, the Dataset Builder, and three workbook visualization tabs: table, pivot, and chart.
|
Analytics Home page |
The Analytics Home page includes Workbook and Dataset subtabs. From the home page, you can open and view any workbooks or datasets you have access to. For more information, see Analytics Home Page. |
|
Dataset Builder |
The Dataset Builder appears after you create a new dataset or open an existing dataset. Use the Dataset Builder to combine record types, fields, and criteria filters to create queries. For more information, see Dataset Builder. |
|
Table tab |
Within a workbook, you can use tables to explore your dataset query results without changing the source data of any associated workbook visualizations and without having to set a layout. For more information, see Table Tab. |
|
Pivot tab |
To pivot your dataset query results, use the Pivot tab. For more information, see Pivot Tab. |
|
Chart tab |
With workbook charts, you can create graphical representations of your dataset query results. For more information, see Chart Tab. |