Getting Started with Web Workspace
The Web Workspace is a real-time application that provides the tool sets and views that are the foundation of the Oracle Utilities Network Management System user environment. The common features and platform provided by the Web Workspace provide a cohesive user experience for Oracle Utilities Network Management System modules. This section provides information on common Web Workspace features, including the following topics:
Understanding the Web Workspace Window
Web Workspace features and functionality are accessed through menus and toolbar buttons. A particular configuration of a user type's environment determines whether a tool is displayed as a window when you first log in to the system.
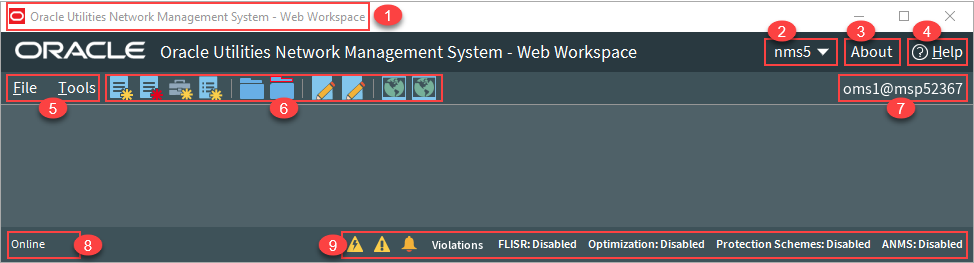
Web Workspace without any tools displayed.
Annotations:
Annotations:
1. Title Bar 2. User Menu 3. About Link 4. Help Link 5. File and Tools Menus | 6. Toolbar 7. Environment Information 8. System Status Indicator 9. Annunciators |
The Web Workspace window contain the following components:
• Title Bars display the name of the tool or dialog box.
• Menus provide access to tools and user actions in the Web Workspace. See
• Annunciators (or indicators) provide visual cues to system state or something that needs your attention.
Understanding the Web Workspace Menus and Toolbar
This section describes the menu and toolbar options. In the tables below, each menu item is listed along with submenu options, if available, and the default toolbar icon, if applicable; menu items without a default toolbar icon are indicated with a double dash(--) in the toolbar icon cell.
Note: Menu and toolbar options vary depending on your user type, your system configuration, and licensed products.
File Menu
Menu Option | Submenu Option | Description | Toolbar Icon |
|---|---|---|---|
New | Switching Sheet... | Opens the New Switching Sheet tool that allows you to create a new switching sheet based on switching event type (for example, planned or emergency). | |
Safety Document... | Opens the New Safety Document tool that allows you to create a new safety document from a set of predefined types. | ||
Event... | Opens the Create Event tool that allows you to create a new outage, new stable outage, non-outage, or restored real outage event. | ||
Damage Assessment... | Opens a new Damage Assessment document window. See “Creating Fuzzy Damage Assessments” for information. | ||
Open | Switching Sheet... | Allows you to open a switching sheet. | |
Switching Sheet Search... | Allows you to search for a switching sheet. By default, the search field searches against the switching sheet number and description fields. See “Open Switching Sheet using Switching Sheet Search”. | -- | |
Safety Document... | Allows you to open a safety document. | ||
Safety Document Search... | Allows you to search for a safety document. By default, the search field searches against the safety document number and description fields. See “From the Web Workspace Search Safety Document Dialog”. | -- |
Tools Menu
Menu Option | Submenu Option | Description | Toolbar Icon |
|---|---|---|---|
Work Agenda 1... | Opens the Work Agenda. See “Using the Work Agenda”. | ||
Work Agenda 2... | Opens a second Work Agenda. | ||
Viewer 1... | Opens the Viewer. See “Using the Viewer”. | ||
Viewer 2... | Opens a second Viewer. | ||
Authority... | Opens the Authority tool, which grants control authority to users subscribing to discrete operations zones. See “Taking Authority for Control Zones”. | -- | |
Crews... | Opens the Crew Actions tool, which shows the crews available in the subscribed control zone. See “Using Crew Actions”. | -- | |
User Log... | Opens the User Log, which displays a list of all single-user actions within a certain time period. See “Using the User Log”. | ||
Manage Documents... | Opens the Manage Documents window, which allows you to associate documents to objects. See “Associating Documents with Devices”. | ||
Topology Validation Viewer... | Opens the Topology Validation Viewer, which displays reports of a number of different common problem areas with a data model, such as de-energized supply points, loops, and faulted areas. See “Topology Validation Viewer” for more information. | -- | |
Switching Overlaps... | Opens the Global Overlaps tool. See “Viewing Global Overlaps”. | ||
Miscellaneous Log... | Opens the Miscellaneous Log. See “Using the Miscellaneous Log”. | ||
Trouble Summary... | Opens the Trouble Summary. See Using the Trouble Summary on page 3-62. | -- | |
Condition Summaries... | Opens the Condition Summaries. Predefined filters include: • All Conditions • FLISR Actions • FLISR Disabled • Notes • Pending Construction • Pending Decommission • Tags See “Condition Summaries” for details. | ||
SCADA Summary... | Displays the SCADA Summary. See “Using the SCADA Summary” for more information. | -- | |
SCADA Status... | Displays the SCADA Status window. | -- | |
Alarms Displays | Alarms... | Display all current alarms in the subscribed authority zones. See “Understanding the Alarms List” | -- |
Abnormal Alarms... | Display a list of off-nominal devices in the subscribed authority zones. See “Understanding the Abnormal Devices List”. | -- | |
Alarm History | Display the alarm history for the subscribed authority zones See “Understanding the Alarm History List”. | -- | |
AMI Request List... | Opens the AMI Request List. See Displaying the AMI Requests List on page 3-57. | -- | |
DMS Summary... | Opens the DMS Summary tool to view the status of distribution management system (DMS) functions and devices. See “Using the DMS Summary”. | ||
Feeder Load Summary... | Opens the Feeder Load Summary, which displays a list of the current feeder loads. See “Using the Feeder Load Summary”. | -- | |
Suggested Switching Solutions... | Opens the SS Solutions tool. See “Using the Suggested Switching Solutions Tool”. | ||
Load Shed and Restoration... | Opens the Load Shed and Restoration tool. See “Understanding the Load Shed and Restoration Tool”. Note: By default, this option is only available for Administration and Trainer user types. | ||
DERMS Dashboard... | Opens the DERMS Dashboard, which provides information related to distributed energy resources (DERs) connected to an electric distribution system. See Chapter 16, DERMS Dashboard, for information. | ||
Conductor Impedance Mismatch Tool... | Opens the Conductor Impedance Mismatch tool, which performs an analysis to locate conductor data anomalies within the Power Flow Data Model and displays the report. See “Using the Conductor Impedance Mismatch Tool” for information. | ||
FLM Islands Statistics... | Opens the FLM Islands Statistics tool. See “Using the FLM Island Statistics Window”. Note: By default, this option is only available for Administration and Trainer user types. | ||
Protection Scheme Analysis... | Opens the Protection Scheme Background Check dialog box, which allows you to start a protection scheme background check. See “Dynamic Protection Schemes” for information. | ||
DMS Settings | FLISR Mode Disabled Manual Automatic | Allows you to set the Fault Location, Isolation, and Service Restoration (FLISR) mode. See “Setting the System FLISR Mode”. | |
FLA Mode • Disabled • Sustained • Momentary and Sustained | Allows Administrators to set the global FLA mode. • Disabled: FLA is disabled for all feeders. • Sustained: FLA is enabled for sustained faults only. • Momentary and Sustained: FLA is enabled for both momentary and sustained faults. Note: The FLA behavior depends on the FLA configuration for that feeder and the FLA mode. See “Global FLA Versus Individual Feeder FLA Configuration” for more information. | ||
Optimization Mode • Disabled • Manual • Automatic | Allows you to set the Optimization mode. See “Setting the Optimization Mode”. | ||
Protection Schemes • Disabled • Manual • Automatic | Allows you to set the Protection Scheme global mode. | ||
FLM Status • Disabled • Enabled | Allows Administrators to set the Feeder Load Management status. See Feeder Load Management “Overview”. • Disabled: FLM forecasts have been disabled, usually due to a model build. Only real-time information will be displayed. • Enabled: FLM forecasts are currently enabled. | ||
ANMS Status • Disabled • Manual • Automatic | Allows Administrators to set the Active Network Management Schemes (ANMS) global mode. See “Understanding ANMS Modes” for more information. Note: you must be logged in as an Administrative user to see this option. |
Understanding the Web Workspace User Menu
The User Menu provides submenus with options to change the appearance and functionality of user interface elements, transfer control of the session to another user, and log out of the Web Workspace.
Understanding the User Interface Settings Menu
The User Interface Settings submenu allows you to set how Web Workspace windows appear to you.
• Theme Selection Radio Buttons: The theme selection allows you to choose whether the Web Workspace uses the Dark Theme or Light Theme.
• The Dark Theme is generally better for low-lit conditions.
• The Light Theme is generally better for well-lit conditions.
Note: Unlike other user preferences, your Theme selection is saved to your workstation user settings since they are more likely influenced by the light in a location. See “Understanding the Manage Preferences Menu” for information about saving other preferences to the database.
• Capitalize Field Labels: If selected, field labels will be displayed in All Caps (for example, NAME). If not selected, field labels will be displayed in title case (for example, Name).
• Toggle Accessible Mode: Changes settings to enable use with screen readers. Note: There are prerequisites to enabling accessible mode. Please see Appendix A‑Accessibility Features for information on enabling Accessible mode.
• Show Messages at Mouse Location: Sets the system to display popup confirmation and warning dialog boxes at your mouse pointer position.
Note: This can be very useful when using multi-monitor configurations so you don’t have to search for confirmation messages and dialog boxes across multiple screens.
• Audio Enabled: Allows you to turn audible alarms on or off.
• Smaller Font: Decreases the font size in text and icons. Repeat to further decrease the font size.
• Bigger Font: Increases the font size in text and icons. Repeat to further increase the font size.
• Reset Font: The application will reset the text and icons to use their default font size.
• Darken Watermarks: Make the watermarks more opaque.
• Lighten Watermarks: Make the watermarks more transparent.
• Show Watermarks: Allows you to toggle watermarks on or off.
Understanding the Table Settings Menu
The Table Settings submenu allows you to configure how tables will appear.
• Alternate Row Coloring: When selected, displays data table rows in alternating colors.
• Capitalize Column Headings: allows you to select whether column labels should be displayed in all capital letters (for example, STATUS) or in title case (for example, Status).
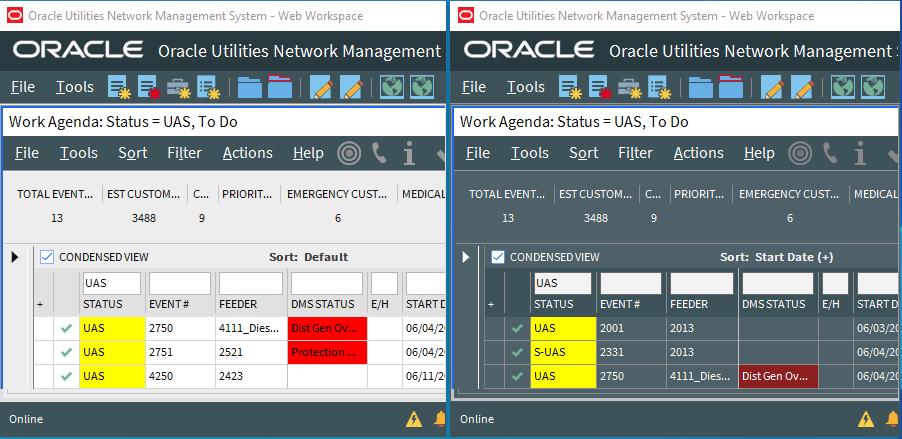
• Table Color Formatting Mode: Determines whether and how tables will display background coloring.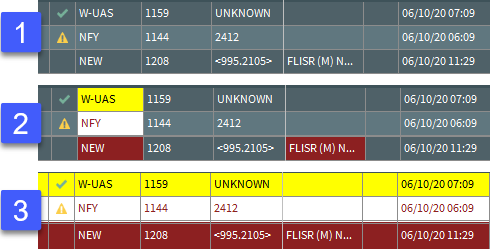
1. None: Tables will not contain color indicators for statuses.
2. Cells: Table cells will contain background colors based on the cell statuses.
3. Row: All cells in a table row will have the background color.
• Table Font Formatting Mode: Determines whether and how tables will display font formatting.
• None: Conditional formatting related to font formatting are never shown
• Cells: Conditional formatting related to font formatting are applied only to the cells they were configured for.
• Row: Conditional formatting related to font formatting are applied across the whole row. Where more than one formatting rule is applied, the highest priority rule is displayed.
Understanding the Manage Preferences Menu
• Manage Workspace Layouts...: Opens the Manage Workspace Layouts dialog box, which allows you to save, rename, update, or delete Workspace Layouts. See “Managing Your Workspace Layout” for details.
• Save Preferences: Saves your preferences to the database so your settings are available wherever you log in. See “Saving Your Preferences” for more information.
Note: Theme selection is saved to your user settings on the workstation since they are more likely influenced by the light in a location. See “Understanding the User Interface Settings Menu” for information.
• Restore Preferences: Opens a dialog box that allows you to select the preferences to restore. See “Saving and Restoring Workspace Preferences”.
• Manage Site-wide Settings:
• Update Site-wide Default Layout: Users who have Administration permissions (having access to the Configuration Assistant) may log in as a different user type, configure, and save the window layout preferences for all users of the log in type.
• Restore Site-wide Default Layout: Returns the client to the default window positioning, sizing
• Update Site-wide Preferences: Users who have Administration permissions (having access to the Configuration Assistant) may log in as a different user type, configure, and save the default preferences for all users of the log in type.
• Restore Site-wide Preferences: Users who have Administration permissions (having access to the Configuration Assistant) may restore the default preferences for the logged in user type to the original configuration. See “Saving and Restoring Workspace Preferences” for more information.
• Transfer...: Logs you out of the system without shutting down the client so another user may log in.
• User Logout: Logs you out of the system and shuts down the client.
Help Menu
Menu Option | Description |
|---|---|
Web Workspace Help | Launches the online help system and loads the Web Workspace content. |
Calculate Network Latency... | Runs a network diagnostic utility and returns the results in the Network connectivity results window. |
Email Log Files... | Gathers the environment's log files and attaches them to a new email message using your default email client. The log files can then be sent to your support team or contact for further analysis. |
Set Debug... | Launches the Set Debug dialog box allowing you to set debug on or off within your current environment. This is used for debugging and analysis purposes. See “Setting Debug” for more information. |
About Web Workspace | Opens a window with environment and software information. |
Understanding Annunciators
Annunciators, located in the bottom right corner of the Web Workspace window, are a combination of symbolic and text-based notifications of system statuses. In the base environment, annunciator alerts are displayed for the statuses listed below.
• Unacknowledged Outage Events (). See “Acknowledging Events” for details on responding to new events.
• Unacknowledged Non-Outage Events (). See “Acknowledging Events” for details on responding to new events.
• Unacknowledged System or Crew Emergency Alarms (). See “Using the Alarm Displays” for information on viewing and acknowledging system alarms.
• Quarantines. The Quarantine alert is displayed when there are quarantined areas. Click the Quarantine annunciator button to display the Quarantine conditions in the Condition Summaries tool. For information on Quarantines, see the following:
• The Viewer's Options menu allows you to set the Quarantine condition on a selected feeder. See “Assessment...” for information on Viewer interactions.
• The Control Tool's Assessment... option allows you to set the Quarantine work queue from the Assessment... context menu. See “Assessment...” for information.
• The Condition Summaries Filter menu allows you to show only Quarantine conditions. See Condition Summaries “Actions Menu”.
• Violations. The Violations alert is displayed when there are devices or feeders in a violation or warning state. Click Violations to open the Feeder Load Summary window in Present Load view. See “Using the Feeder Load Summary” for information.
• FLISR Mode Status. FLISR mode is displayed when FLISR is set to Manual or Automatic. See “DMS Settings” and “Fault Location, Isolation, and Service Restoration” for more details on using FLISR.
Notes:
• Setting FLISR Mode and/or Optimization Mode determines the system-wide behavior, which may override the feeder level configuration, which is set using the Configuration Assistant. The following rules apply.
• If the system or feeder is disabled, then Optimization/FLISR is disabled, next
• If the system or feeder is manual, then Optimization/FLISR is manual, next
• If the system and feeder are automatic, then Optimization/FLISR is automatic
• ANMS Mode Status. Global ANMS mode is displayed. See the DMS Settings menu’s description of “ANMS Status” for more information and the ANMS chapter’s Global ANMS mode section.
Note: Additional annunciators may be added on a per implementation basis.
Understanding Windows, Frames, and Dock Panes
Some Web Workspace tools display as dock panes within the Web Workspace, and others display as standalone windows. Dock panes may be moved within the Web Workspace, dragged out of the Web Workspace window where they may float or be docked in a window frame (see “Creating Window Frames”).
Web Workspace tool windows may be moved and sized in many ways. Initially, window positioning is determined by the product or project configuration, but you may move and size windows to support your workflow and preferences. You can save your window configuration for future sessions by using Manage Workspace Layouts (see “Managing Your Workspace Layout” for information).