Create a Report on Base Views
Oracle Analytics Publisher enables users of the Oracle Health Insurance Cloud Services that have appropriate roles to use the base views and create a report based on that data model with SQL statements. The reports generated by Oracle Analytics Publisher include drill-down reports of SQL queries that display more extensive and detailed information about the selected base views.
The following components are needed to within Oracle Analytics Publisher to prepare a report.
-
Data Model
-
Report Template
Using the SQL queries against the Oracle Health Insurance base views, such as Oracle Health Insurance Claims Adjudication and Pricing, you can report layout in an appropriate format.
Create a Data Model
Creating a data model is a five-step process described in the following subsections. Use this process to create a data model that will subsequently be used to create an Oracle Publisher Oracle Health Insurance Cloud Services Report:
-
Getting Started
-
Create a Data Set Using SQL Query
-
Create a Data Set Using SQL Query Builder
-
Test Data Models and Generate Sample Data
-
Save the Test Data
See the Oracle Analytics Publisher documentation for more options for creating data models.
Getting Started
Oracle Analytics Publisher retrieves the data from multiple types of base views available in Oracle Health Insurance components. The first step in creating a new report is to select the source of the base views for the report.
To know more about Base Views refer to the Oracle Health Insurance Developer Guide.
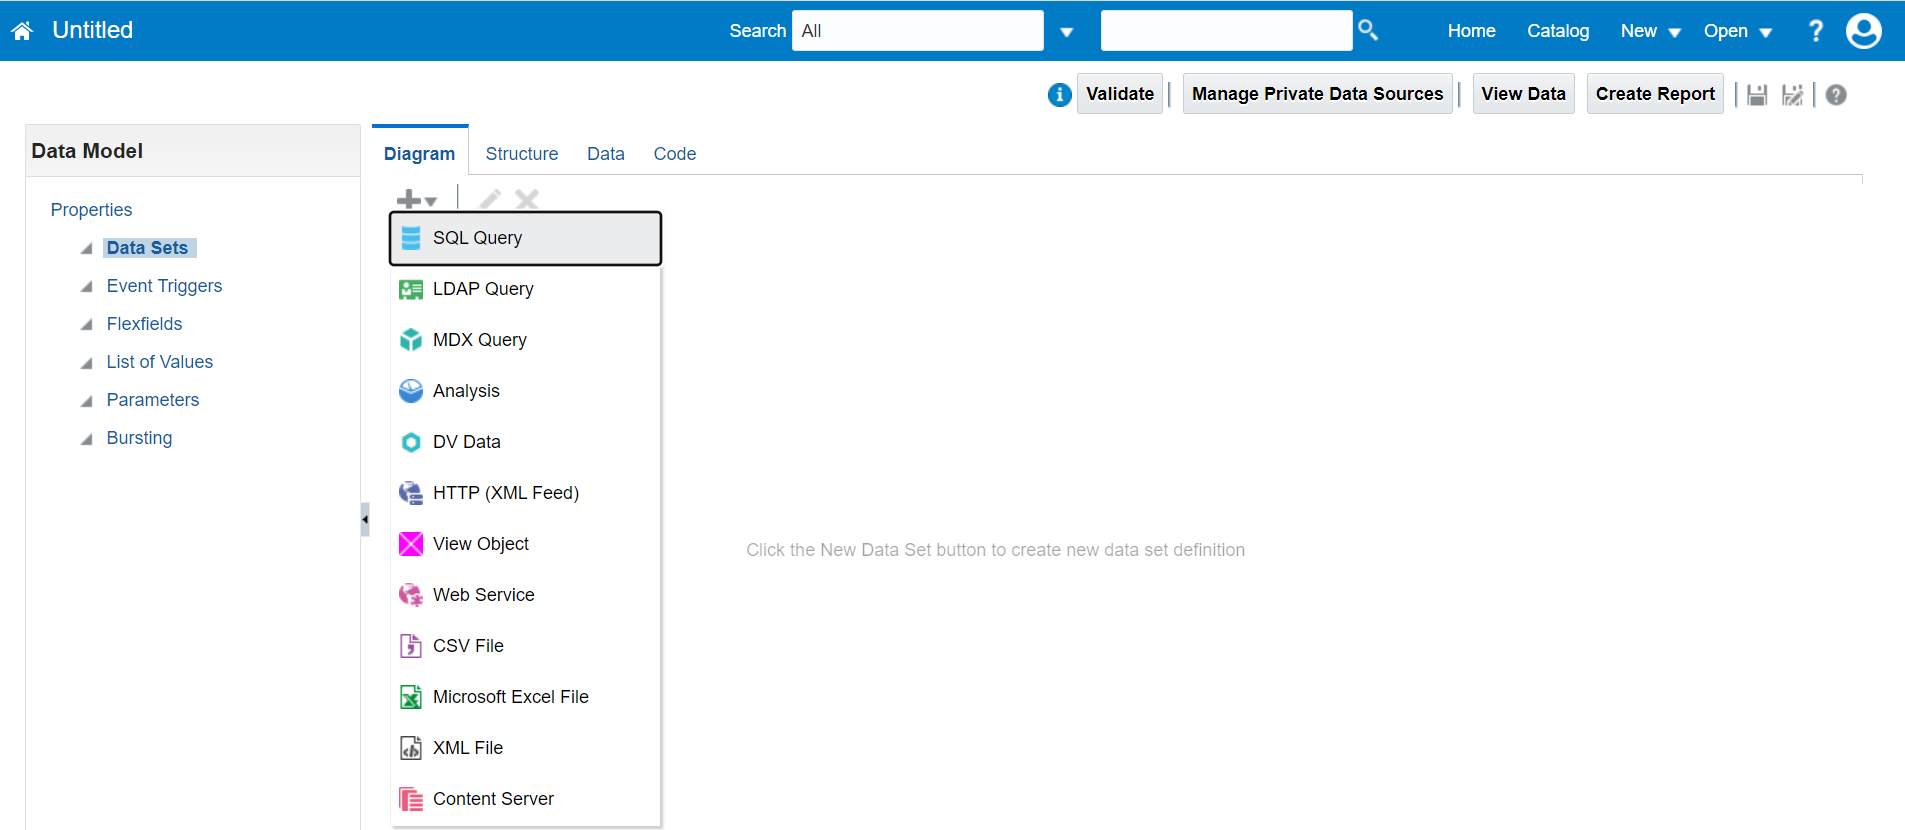
To select the source of the base views, first select the SQL Query option as described below:
-
Navigate to https://<environment-host>/xmlpserver as an administrator user.
-
On the home page, under Create, select Data Model.
-
In the Data Model navigation pane, select Data Sets, and select SQL Query from the Diagram tab.
-
Enter the required fields, as described in the following sections.
Create a Data Set Using SQL Query
A dataset contains the logic to retrieve data from the base views. You can use one of these Oracle Health Insurance components data source connections to create a dataset containing multiple tables.
-
BV_<AppD>_Capitation_DS
-
BV_<AppD>_Claims_DS
-
BV_<AppD>_Gateway_DS
-
BV_<AppD>_Policies_DS
-
BV_<AppD>_Authorizations_DS
Here, <AppD> indicates Application Deployment. A single environment can have multiple application deployments.
For example, a nonprod environment can have dev2 and uat application deployments.
For each OHI application within an application deployment, a data source is present.
To create a new dataset, follow the below steps:
-
In the New Data Set - SQL Query dialog box,complete the following fields:
Name
Enter the name of the new data set. For example, Find Users.
Data Source
From the drop-down, select the desired data source to create Reports. The data source is the Oracle Health Insurance application components Database instance.
Type of SQL
Select the type of SQL. The default is Standard SQL, which is used for the normal SELECT statements.
-
Type the appropriate SQL query in the box and click OK.
Alternatively, you can also use Query Builder functionalities to build SQL queries as described in the following section.
Create a Data Set Using SQL Query Builder
The Query Builder allows you to search and filter database objects, select objects and columns, and view formatted query results with minimal SQL knowledge.
The Query Builder page is divided into two sections:
-
Base Views Selection pane contains a list of tables from which you create queries. Only the database views of the current schema are displayed.
If required database views is not available then send the following queries to generate the views:POST://<enviroment-host>/<applicationComponent>/baseviews/generate
|
-
Output pane consists of four tabs:
-
Model — Displays selected views from the Table Selection pane.
-
Conditions — Applies conditions on the selected columns or views.
-
SQL — Displays the selected query.
-
Results — Displays the results of the query.
-
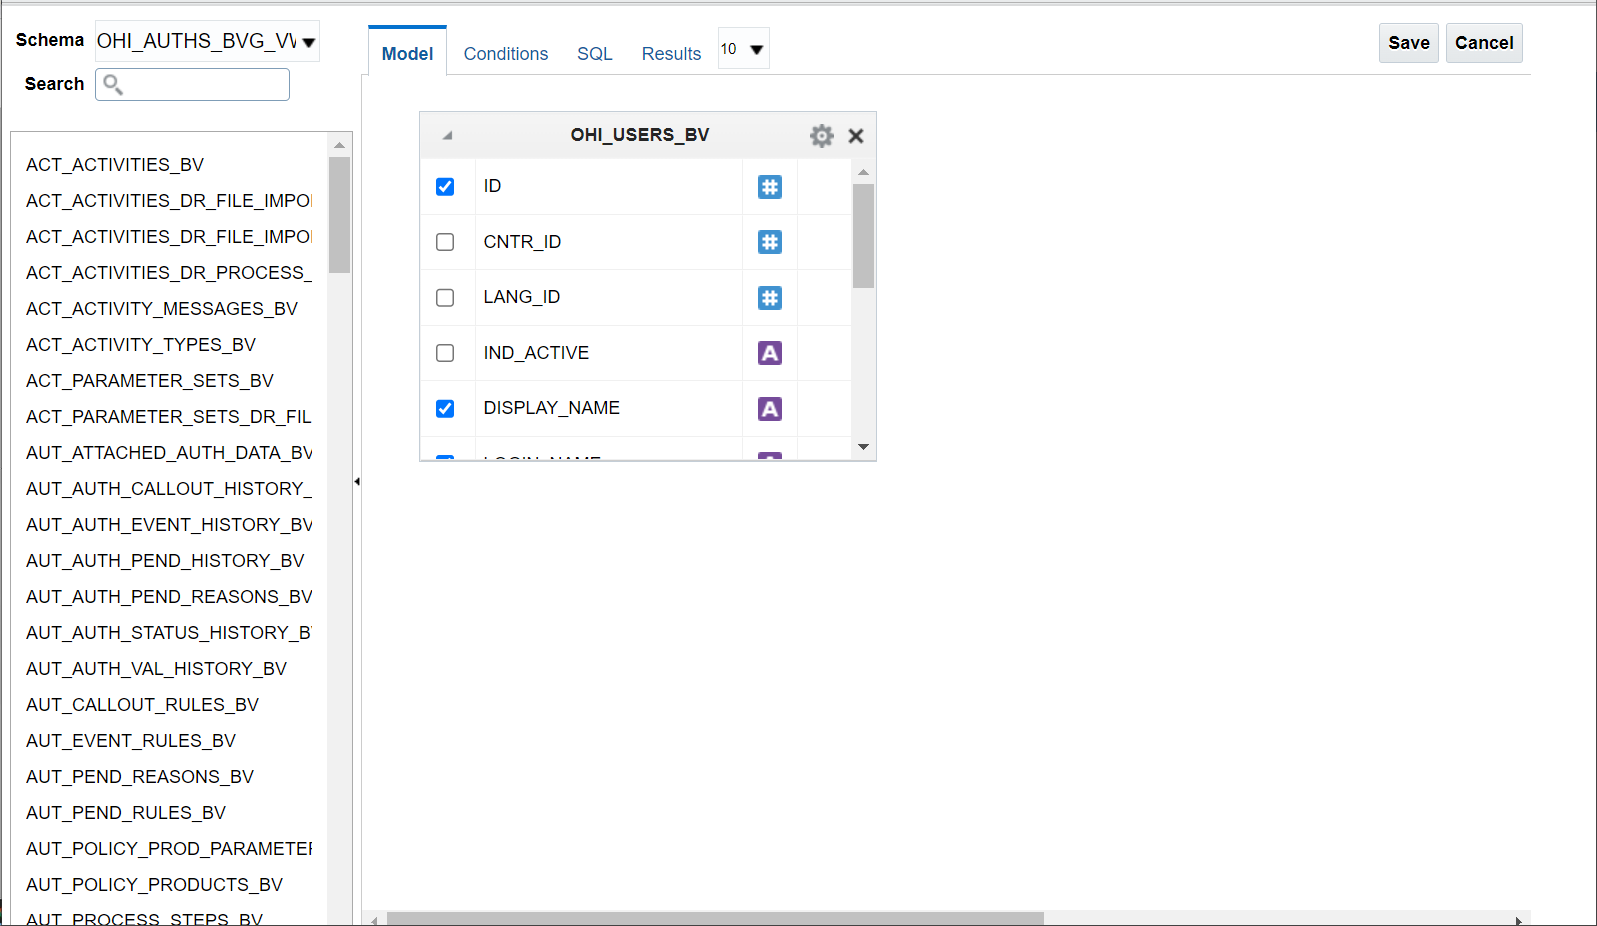
To build a query, follow these steps:
-
In the query builder tool (refer to the above illustration ), select the Schema from the drop-down list. Here Schema is an Oracle database schema that contains the tables and data sets of the environment.
-
In the search field, enter the view name for which you are searching.
-
Select a View. The selected view displays in the right Design pane. An icon representing the data type displays next to each column name.
-
Scroll through the selected table columns and check the required boxes to include in your query.
-
Optional, Click Condition, and enter the Condition for selected table.
-
Conditions enable you to filter and identify the data you want to work with. As you select columns within an object, you can specify conditions on the Conditions tab. You can use these attributes to modify the column alias, apply column conditions, sort columns, or apply functions.
-
-
Optional, to see the sample of the data set, click Results.
-
Click Save. The SQL Query is created as illustrated below:
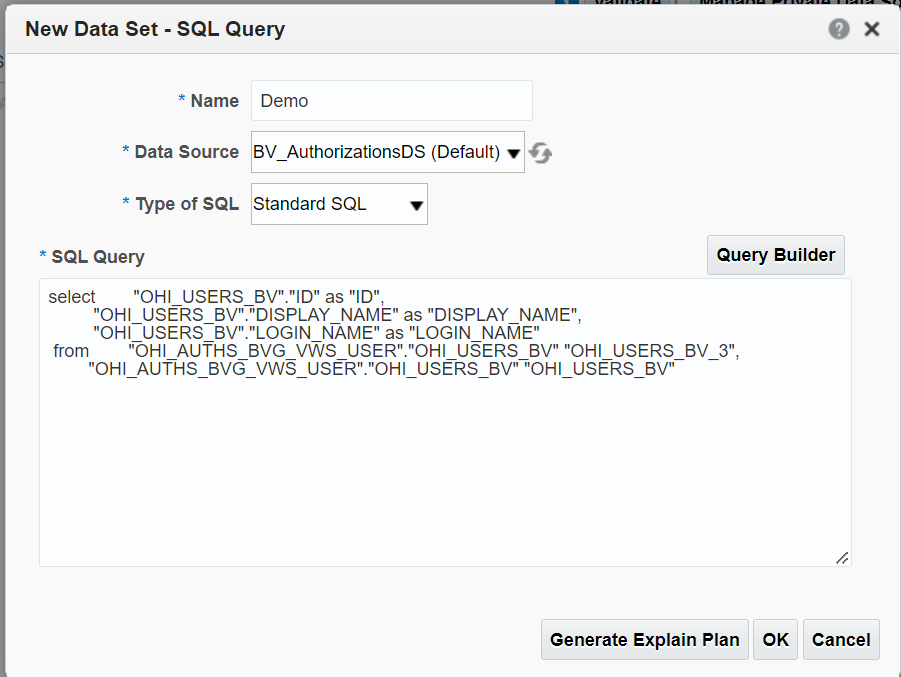
-
In the New Data Set - SQL Query dialog box, click OK. A data model is created and displayed successfully.
Test Data Models and Generate Sample Data
The data model editor enables you to test your data model and view the output to ensure your results are as expected. After running a successful test, you can choose to save the test output as sample data for your data model.
To test your data model:
-
In the data model editor, click View Data. The Data page is displayed.
-
In the Data, click View to display the selected columns that are returned by the data model.
-
Select one of the following options to display the sample data:
-
Click Tree View to view the sample data in a data hierarchy. This is the default display option.
-
Click Table View to display the sample data in a table.
-
Create a Report
The following components are required to create a report:
-
Data Model: A Data Model defines database views that are used by a report.
-
Layout: The layout defines how the data is presented in the report.
-
Properties: Report properties give you control over the way reports are displayed.
To create a report, follow the below steps:
-
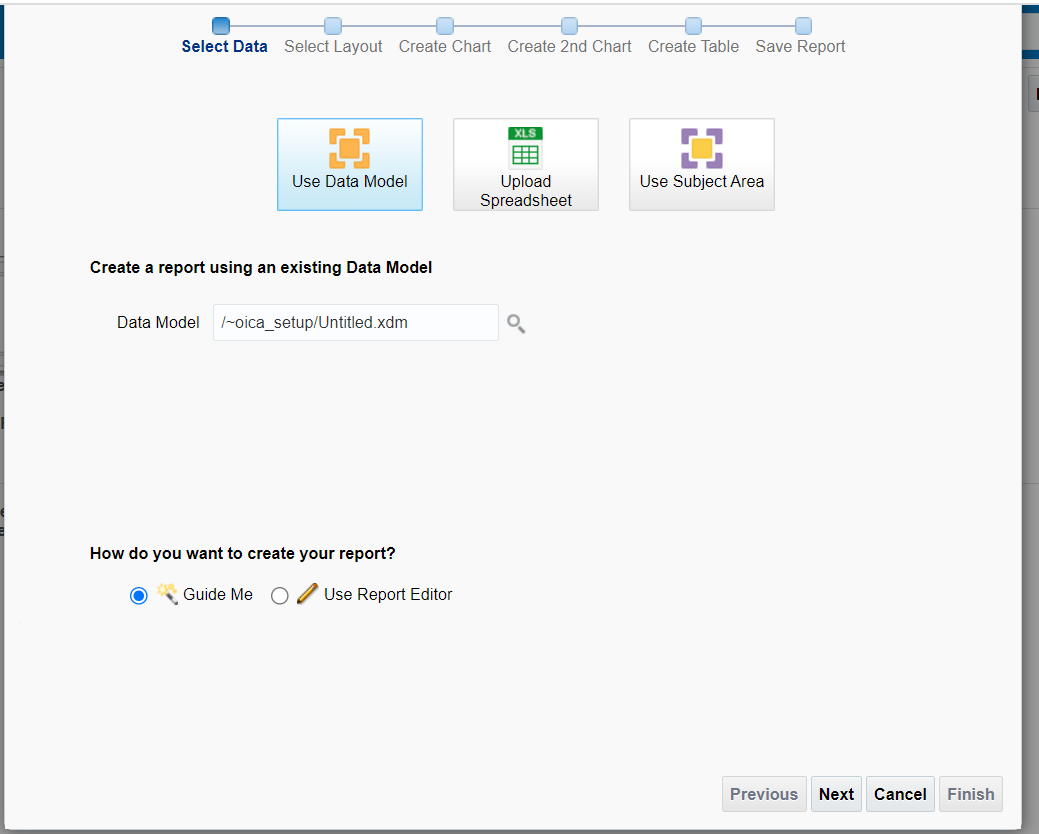
On the Data model page, click Report. The following dialog box is displayed.
-
Alternatively, from the Home page, under Create, click Report.
-
-
In the Data Model, select an existing data model from the drop-down.
-
Select Guide me under How do you want to create your report?, and then click Next.
-
In Select layout, select the page options and layout, and click Next to proceed.
The selected Data Source is displayed on the Create Table page. -
Add columns to the layout by dragging and dropping them from the Data Source pane to the table area.
-
To remove a column from the table, hover your mouse over the upper-right hand corner of the column header and click Delete.
-
-
By default, The Show Grand Totals row option is selected to automatically display an aggregated summary row for all columns. Clear this option to remove the row from the table.
-
Add Data Source elements to the report components (for example, charts, data tables, pivot tables) to create the layout, and then click Next.
-
Select one of the following options:
-
To run and view the report,select View Report.
-
To customize the report in the Layout Editor, select Customize Report Layout.
-
-
Click Finish. The final page prompts you to save the report.
-
Select the report folder, enter the report name, and then click Save. After saving, Oracle Analytics runs and displays the report in the report viewer.
-
You have the option to export the report to your local machine. Also, you can share the URL of the generated report in
.xdo.extension.