You use the Property Prioritization tab to specify the priority of different properties for influencing the order of search results. The priority of a property takes into account the weighting of the property relative to other properties, and the ranking of the property’s values relative to each other (e.g., whether high values are considered “better” or “worse” than low values). For example, you might specify that price is the highest-priority property of products, and that high-priced products should be emphasized. When the search configuration is applied, higher-priced products will tend to appear higher on the list of search results than lower-priced products. Note that the best way to promote specific products, rather than specific characteristics, is to use positioning rules.
An administrative user configures the Merchandising UI to make certain properties available for specifying their priorities. These properties are displayed in a table on the Result Prioritization tab. For example:
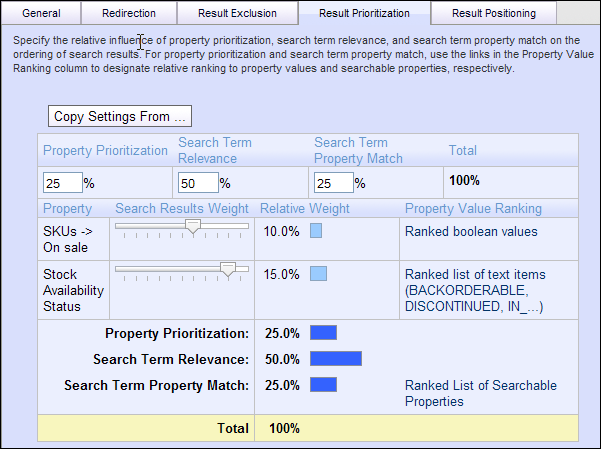
To specify the weighting of a property, use the slider in the Search Results Weight column. The slider can move through eleven positions, each of which represents the influence a property has in the overall result ordering. Each property’s influence depends both on the influence of other properties in property prioritization as well as the overall percentage assigned to property prioritization. As you make changes to a slider for one property prioritization property, you’ll not only see the percentage for it change but also the percentage for all other property prioritization properties change.
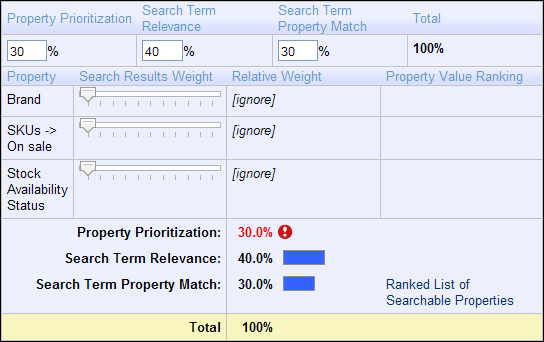
For example, suppose you set property prioritization to 30%, search term relevance to 40% and search term property match to 30%. The initial setting for each property is the first position, ignore, which means the property is not considered when determining the order of search results.
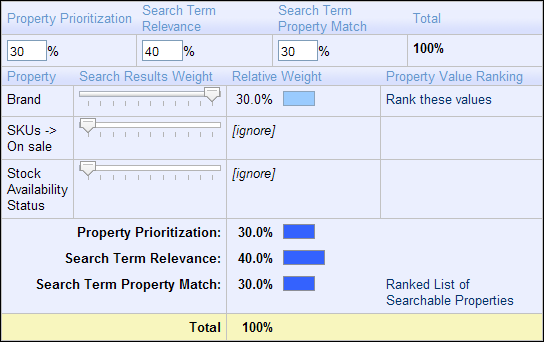
If you have three properties and move the slider for one of them to the last position, the entire 30% of your property prioritization allocation will be applied for that one property.
If you move the slider for a second property into the same position, the first two properties will have 15% each until you move the slider for the third to the same spot, causing all three properties to have 10%.
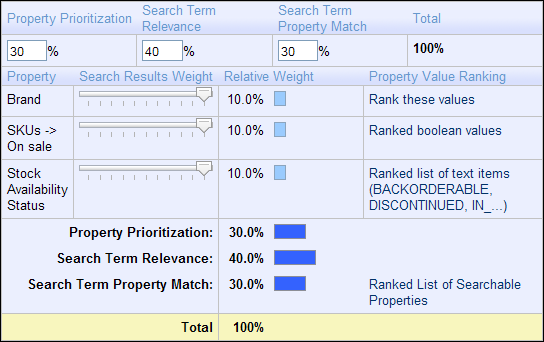
What the sliders demonstrate is how the influence of a property is relative to the influence of other properties. As you use the sliders, the specific position of the slider is not as important as the percentage that position gives to a given property in relation to others.
For each property, text appears in the Property Value Ranking column describing the criteria for ranking the property values. The text in this column is a link to a screen where you can specify the criteria for ranking the property’s values. For properties with a fixed set of possible values (such as On sale and Stock Availability Status in this example), the software can automatically assign rankings to the values, though you may want to click the link to change these, because the default rankings may not be what you want. For properties whose ranking criteria cannot be determined automatically (such as Brand), the text link Rank these values appears. In this case, you must click the link to specify further ranking information.
Specifying the Ranking of Property Values
To rank property values, you first need to allocate a percentage weight to that property, by moving the slide beneath it. A link appears in the Property Value Ranking column, and by clicking it, you’ll see a page that provides the tools you need to rank values. What you see depends on the data type for the property you’re working with:
Data Type | Options |
|---|---|
Numeric | You can specify that higher values are better (have higher ranking) or that lower values are better. If you select one of these options, you must also specify the minimum and maximum expected values for the property. The other option is to divide up the data into ranges and then specify a relative ranking for each range. Numbers outside of a specified range use the ranking given to “All Others.” |
Date | You can specify that earlier dates are better (have higher ranking) or that later dates are better. If you select one of these options, you must also specify the earliest and latest expected dates. Dates outside of this range use the ranking given to “All Others.” The other option is to divide up the dates into ranges and then specify a relative ranking for each range. |
Text | You can specify a set of text values (e.g., |
Enumeration | An enumeration is a property with a fixed set of possible values (e.g., a “days of the week” property would have 7 possible values). You can specify a relative ranking for each value. |
Boolean | A Boolean is a property with whose value is either |
To specify ranges of rankings to text properties and some numeric and date properties, you use the Add button to add an entry in the table, and then provide a ranking and value or value range as needed. You can add entries in any order, and when you want to organize the table in rank order (strongest to weakest), click the Reorder button.
For every property value type, you have the option of specifying value ranges and number rankings that order the importance of each range relative to others. Consider the Creation Date property which uses Date data type. In order to promote new seasonal items, you might create the following ranges:
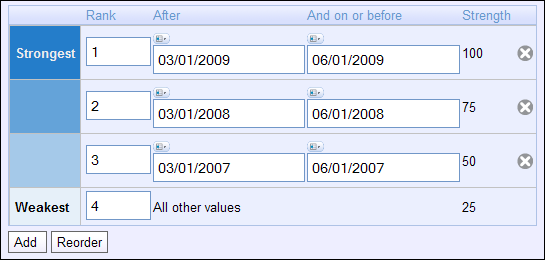
That way, customers see the newest items created for spring before other items. Notice that the All Other Values is last in the list, so items created at any date other than one included in the specified ranges will appear later in the list.
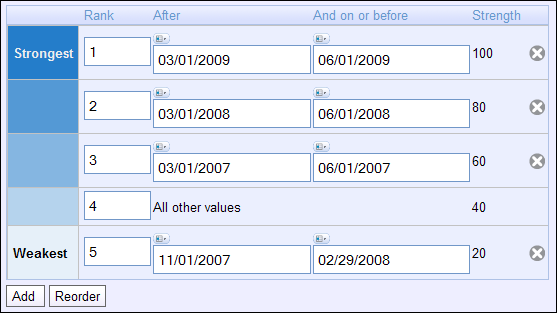
When you are defining ranges, the All Other Values option automatically appears at the top of a list but can be moved to any position as shown in the previous example. If you want to hide products created in the winter of 2007-2008, you might move the All Other Values to a middle position, for example:
In these examples, rankings are unique and consecutive although they needn’t be. Giving two property values the same ranking means that for this one criterion, ATG Search sets them as equals. Keep in mind, however, that a ranking is one of several settings that determine a result’s place in the results list.
Nonconsecutive rankings work much like nonconsecutive weightings. Consider the following example:

In addition to providing a relative order, ranking provides a relative distance that determines how far apart results appear from others. Products created during November-February 2006 (with a ranking of 12) will appear significantly lower – as much as 3 times lower - in the results list than those created on a date that doesn’t fall into a specified range (with a ranking of 4). A ranking setting’s exact influence on a search result’s position may be difficult to determine because it incorporates a number of factors, such as property weightings and the order of the result list before search configuration settings are applied.
When you specify rankings, it’s important to know exactly what effect you are trying to define. For example, you would create the rankings in the prior example if you want products created in the winter of 2005-2006 to display, but to display after all others. If you don’t want such products to display at all, it’s best to use a result positioning or exclusion rule to hide them rather than specify a wide range of rankings here. Giving winter products a ranking of 100, for example, serves to eliminate the distinctions between the ranges that are ranked closely together (spring products for 2007, 2006, and 2005) rather than de-emphasize the winter products.
