Packet sniffers are a type of passive service. Rather than opening up a TCP port and actively listening for requests, the packet sniffer passively reads data packets off the network interface. The sniffer assembles these packets into complete messages that can then be passed into an associated policy.
Because the packet sniffer operates passively (does not listen on a TCP port) and transparently to the client, it is most useful for monitoring and managing web services. For example, you can deploy the sniffer on a machine running a web server acting as a container for web services. Assuming that the web server is listening on TCP port 80 for traffic, the packet sniffer can be configured to read all packets destined for port 80 (or any other port, if necessary). The packets can then be marshaled into complete HTTP/SOAP messages by the sniffer and passed into a policy that, for example, logs the message to a database.
Because packet sniffers are mainly used as passive monitoring agents, they
are usually created in their own service group. For example, to create
a new group, right-click the API Gateway instance under Listeners
in the Policy Studio tree, and select Add Service Group. Enter
Packet Sniffer Group in the dialog.
You can then add a relative path service to this group by right-clicking
the Packet Sniffer Group, and selecting Add Relative
Path. Enter a path in the field provided, and select the policy
to dispatch messages to when the packet sniffer detects a
request for this path (after it assembles the packets). For example, if
the relative path is configured as /a, and the packet sniffer
assembles packets into a request for this path, the request is dispatched
to the policy selected in the relative path service.
Finally, to add the packet sniffer, right-click the Packet
Sniffer Group node, and select Packet Sniffer >
Add, and complete the following fields:
Device to Monitor:
Enter the name of the network interface that the packet sniffer monitors.
The default is any (valid on Linux only). On UNIX, network
interfaces are usually identified by names like eth0 or
eth1. On Windows, names are more complicated (for example,
\Device\NPF_{00B756E0-518A-4144 ... }).
Filter:
You can configure the packet sniffer to only intercept certain types of packets. For example, it can ignore all UDP packets, only intercept packets destined for port 80 on the network interface, ignore packets from a certain IP address, listen for all packets on the network, and so on.
The packet sniffer uses the libpcap library filter
language to achieve this. This language has a complicated but powerful
syntax that enables you to filter what packets are
intercepted, and what packets are ignored. As a general rule, the syntax
consists of one or more expressions combined with conjunctions, such
as and, or, and not. The following
table lists a few examples of common filters and explains what they filter:
| Filter Expression | Description |
|---|---|
port 80 |
Captures only traffic for the HTTP Port (i.e. 80). |
host 192.168.0.1 |
Captures traffic to and from IP address 192.168.0.1. |
tcp |
Captures only TCP traffic. |
host 192.168.0.1 and port 80 |
Captures traffic to and from port 80 on IP address 192.168.0.1. |
tcp portrange 8080-8090 |
Captures all TCP traffic destined for ports from 8080 through to 8090. |
tcp port 8080 and not src host 192.168.0.1 |
Captures all TCP traffic destined for port 8080 but not from IP address 192.168.0.1. |
The default filter of tcp captures all TCP packets arriving on the
network interface. For more details on how to configure filter expressions, see
http://www.tcpdump.org/tcpdump_man.html.
Promiscuous Mode:
When listening in promiscuous mode, the packet sniffer captures all packets on the same Ethernet network, regardless of whether the packets are addressed to the network interface that the sniffer is monitoring.
API Gateway can capture both incoming and outgoing packets when it is listening passively (not opening any ports) on the network interface. For example, a web service is deployed in a web server that listens on port 80. API Gateway can be installed on the same machine as the web server. It is configured not to open any ports and to use a packet sniffer to capture all packets destined for TCP port 80.
When packets arrive on the network interface that are destined for this port, they are assembled by the packet sniffer into HTTP messages and passed into the configured policy. Typically, this policy logs the message to an audit trail, and so usually consists of just a Log Message filter.
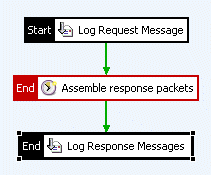
To also log response messages passively, as is typically required for a complete audit trail, you can use the Wait for Response Packets filter to correlate response packets with their corresponding requests. The Wait for Response Packets filter assembles the response messages into HTTP messages and can then log them again using the Log Message Payload filter. The following policy logs both request and response messages captured transparently by the packet sniffer:
 |
You can see from the policy that the first logging filter logs the request message. By this stage, the packet sniffer has assembled the request packets into a complete HTTP request, and this is what is passed to the Log Request Message filter. The Assemble response packets filter is a Wait for Response Packets filter that assembles response packets into complete HTTP response messages and passes them to the Log Response Message filter, which logs the complete response message. More information on the Log Message Payload filter is available in the Log message payload topic.

