Email Summary Dashboard
Note: This dashboard is available only to users with the Email Analytics Manager role.
This dashboard provides an at-a-glance summary of the Email channel performance. The dashboard helps you analyze trends in Email performance metrics over time and provides drill-down to the detailed campaign for deep-dive analysis. Learn more about creating an email campaign with the Email Message Designer.
This dashboard includes the following charts and table:
- Performance Trend Chart
- Campaign Exploration Chart
- Performance by Marketing Strategy Chart
- Performance by Campaign Purpose Chart
- Performance by Device Chart
To open the Email Summary dashboard:
- Click
 Insight on the side navigation bar, and select Interactive Dashboards.
 - Click Dashboards > Analytics.
- On the Analytics page, select the Email tab.
Dimensions
A dimension is a data attribute used to categorize or filter a measure. A measure by itself has no meaning if presented without the context of a dimension.
| Dimension | Definition |
|---|---|
| Sent Date | Day corresponding to the sent date |
| Marketing Strategy | Marketing Strategy defined during campaign design . Note that prior to 19A, if you changed a campaign’s marketing strategy for a standard launch, then historical launches would keep the old values in Insight, while new launches would take the new values. Post 19A, Insight will display the new marketing strategy values for both historical and new standard launches. This update applies to all channels. It does not impact the CED behaviour. |
| Marketing Program | Marketing Program defined during campaign design. Note that prior to 19A, if you changed a campaign’s marketing program for a standard launch, then historical launches would keep the old values in Insight, while new launches would take the new values. Post 19A, Insight will display the new marketing program values for both historical and new standard launches. This update applies to all channels. It does not impact the CED behaviour. |
| Campaign Purpose | Specifies whether the campaign is Promotional or Transactional |
| Device Type | Type of device used to respond to the message, for example Mobile, Desktop, or Tablet |
Measures
A measure is a numerical measurement representing the calculations gathered from your Oracle Responsys account and applied to your reports.
| Measure | Definition |
|---|---|
| Sent | Number of sent messages. |
| Opens | Number of email messages opened, including multiple opens, except Auto Opens. Learn more about tracking opens. |
| Clicks | Count of total clicks; that is, clicks on all links, including multiple clicks on the same link(s). Unsubscribes do not register as Clicks. |
| Conversions | Number of conversion actions. Learn more about conversion tracking here. |
| Delivered | Number of successfully delivered messages (that is, Sent minus Bounced) |
| Unsubscribes | Count of unsubscribes. Unsubscribes do not register as Clicks. Learn more about setting up the default unsubscribe action for campaigns. |
| Revenue | Total revenue associated with a particular campaign launch. Learn more about revenue tracking. |
| Click-Through Rate | (Total Clicks / Delivered) * 100% Unsubscribes do not register as Clicks and therefore do not contribute to the calculation of Click-Through Rate, which is why a campaign's Click-Through Rate may be different from its Unsubscribe Rate. |
| Conversion Rate | (Conversions / Delivered) * 100% |
| Delivered Rate | (Delivered / Total Emails Sent) * 100% |
| Open Rate | (Opens / Delivered) * 100% |
| Unsubscribe Rate | (Unsubscribes / Delivered) * 100% Unsubscribes do not register as Clicks and therefore do not contribute to the calculation of Click-Through Rate, which is why a campaign's Click-Through Rate may be different from its Unsubscribe Rate. Learn more about setting up the default unsubscribe action for campaigns. |
| Revenue Per Email | (Total Revenue / Total Delivered) |
Summary of Key Performance Metrics
This section of the dashboard provides a quick overview of the following key performance metrics for the Email channel:
- Sent - Number of sent messages.
- Delivered Rate - (Delivered / Total Emails Sent) * 100%
- Unique Open Rate - (Unique Opens / Delivered) * 100%
- Unique Click-Through Rate - (Unique Clicks / Delivered) * 100%
- Unique Conversion Rate - (Unique Conversions / Delivered) * 100%
- Unsubscribe Rate - (Unsubscribes / Delivered) * 100%
Unsubscribes do not register as Clicks and therefore do not contribute to the calculation of Click-Through Rate, which is why a campaign's Click-Through Rate may be different from its Unsubscribe Rate. Learn more about setting up the default unsubscribe action for campaigns. - Revenue Per 1K Email - (Total Revenue / Total Delivered) * 1000
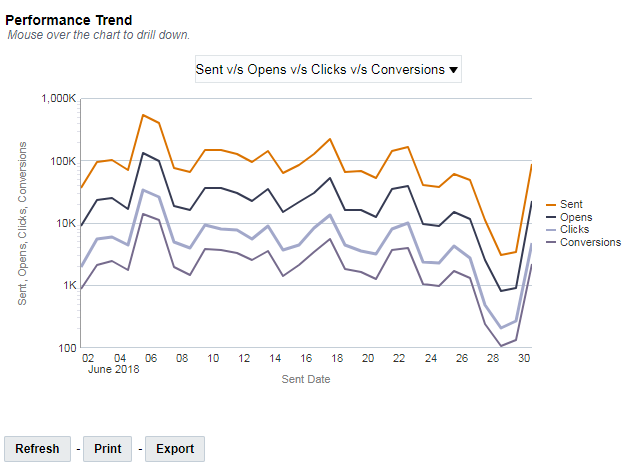
Performance Trend Chart
This chart trends performance metrics for Email campaigns, including Sent, Delivered, Opens, Clicks, Conversions, Unsubcribes, and Revenues over the sent date of the campaign. The metrics are plotted against each other for comparison.
For a deeper campaign-level analysis of the trend at a specific point, click the point to drill down to the campaigns that contribute towards the trend.
You can also plot the performance metrics against each other for a comparison over time. To do this, select the comparison from the drop down list.
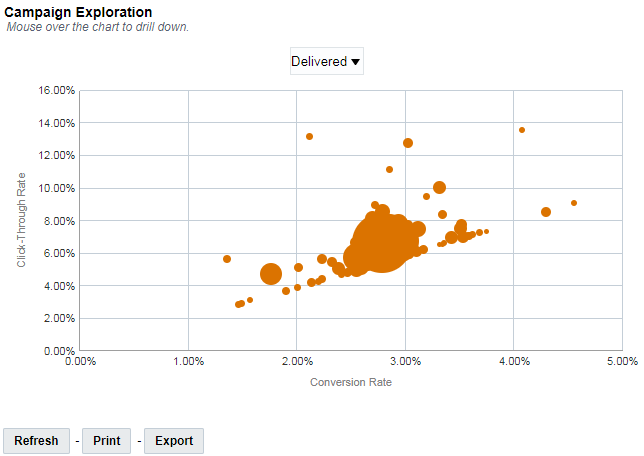
Campaign Exploration Chart
This chart plots the Email campaigns by Click-Through Rate and Conversion Rate. This chart is useful for visualizing the relative performance of campaigns. For example, campaigns with high Click-Through Rates but low Conversion Rates are easily exposed and might need more analysis to understand the cause of low conversions.
For a deeper analysis of a particular campaign, click a bubble to drill down to the detailed campaign data.
To switch between the volume of delivered messages and revenue, select the option you want from the drop down list.
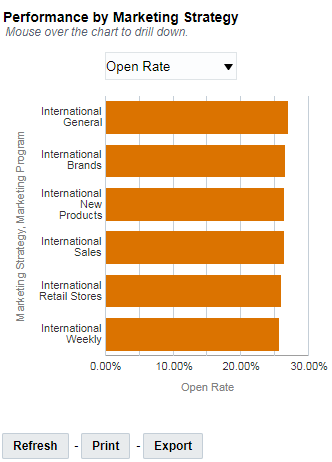
Performance by Marketing Strategy Chart
This chart identifies the top performing marketing strategies by Open Rate, Click-Through Rate, Revenue Per Email, Unsubscribe Rate, or Conversion Rate.
For a deeper analysis into the programs that contribute towards the success of that marketing strategy, click the name of the marketing strategy.
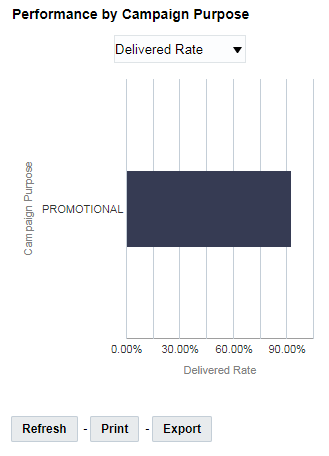
Performance by Campaign Purpose Chart
This chart shows the distribution for Click-Through Rate, Delivered Rate, Open Rate, Conversion Rate, Unsubscribe Rate, Revenue Per Email, Sent, or by the purpose of the campaign (either Promotional or Transactional).
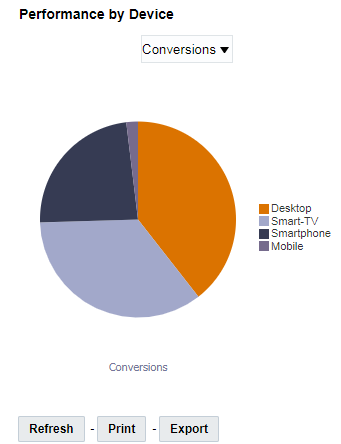
Performance by Device Chart
This chart identifies performance by device type by Clicks, Opens, or Conversions.