The Solution Use Counts report provides detail on use counts for solutions in owning groups.
You can choose to view the top X number of solutions with the highest use counts, or the bottom X number of solutions with the lowest use counts. Use count information helps to determine which solutions seem to be most effective (or ineffective) at solving customer problems.
To view the report, you optionally select an owning group and then select either the highest use counts or the lowest use counts. You can select how many to display along with how they should be ordered, ascending or descending. The date selection forces you to select a time period in which the solution was last linked so that you don’t get old solutions with high use count if they are not relevant to current customer problems.
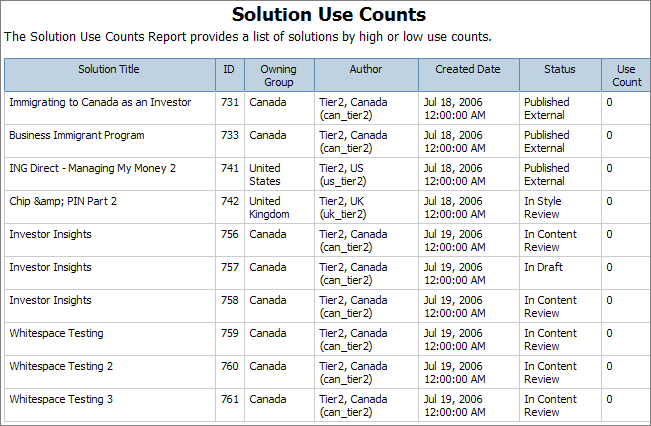
The following is an example of the Solution Use Counts report: