Arranging Data on Summary Reports
Summary view is the default display for all reports. Many reports also let you drill down into a detail view.
When you edit columns of a summary report in the Report Builder, you can specify how each column's data is aggregated by applying a summary type.
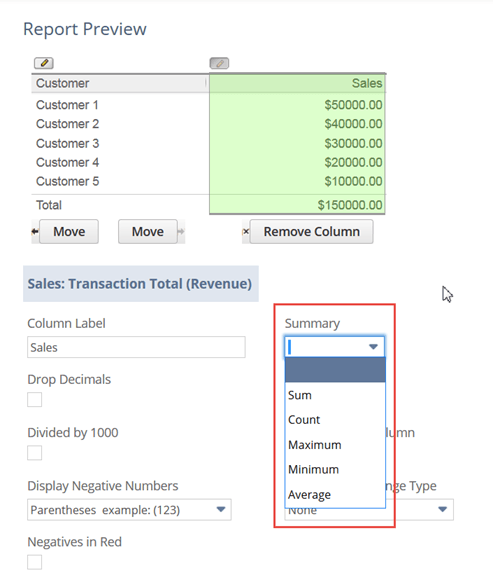
Most columns with numeric, percentage, or currency values let you select summary types. You can choose from the following summary types:
-
Sum - Sums the values for the field.
-
Count - Counts the number of report results for the field.
-
Maximum - Displays the maximum value.
-
Minimum - Displays the minimum value.
-
Average - Calculates the average value for the field.
-
Group - Available for custom fields only. Rolls up report results by the custom field to which you apply this summary type.
For example, when you create a customized Sales by Customer report, you can set the Sales column to display the average purchase amount for each customer. To do this, choose Average as the summary type for the Sales field.
If you apply a summary type to a column that also has the Add Grand Total option enabled, the total row value is still calculated as the sum of the rows.
Related Topics
- Report Customization
- Report Builder Interface
- Report Customization Permission
- Adding, Removing, or Reordering Report Columns
- Formatting Numbers on Reports
- Filtering Data on Reports
- Sorting Data on Reports
- Setting Additional Options for Custom Reports
- Setting Up Cash Basis Reporting
- Sharing Custom Reports with Other Users
- Exporting a Saved Report as an Excel Web Query
- Example Report Format Changes
- Saving a Custom Report
- Deleting a Custom Report