Inspector is a tool that provides you with real-time feedback about which Rules are active and how they are being evaluated. This enables you to see what is being done within a Site as a result of Engagement Engine activity. You can open the Inspector tool by following these instructions:
Click on the Settings button on the navigation bar.
Copy the contents of the Inspector Key window.
Go to your internet browser that is displaying the page on which you wish to inspect Engagement Engine activity.
Open the browser script console. The precise method of doing this depends on which browser you are using.
Paste in the Inspector key into the browser script console and run the command. This should return ‘OK’ and create a session cookie that enables the Inspector tool.
Refresh the page to activate the Inspector tool.
The Inspector tool should display on your screen when the page reloads. If the Inspector tool does not reload then check that session cookies are enabled and that an eeDebugKey session cookie has been created.
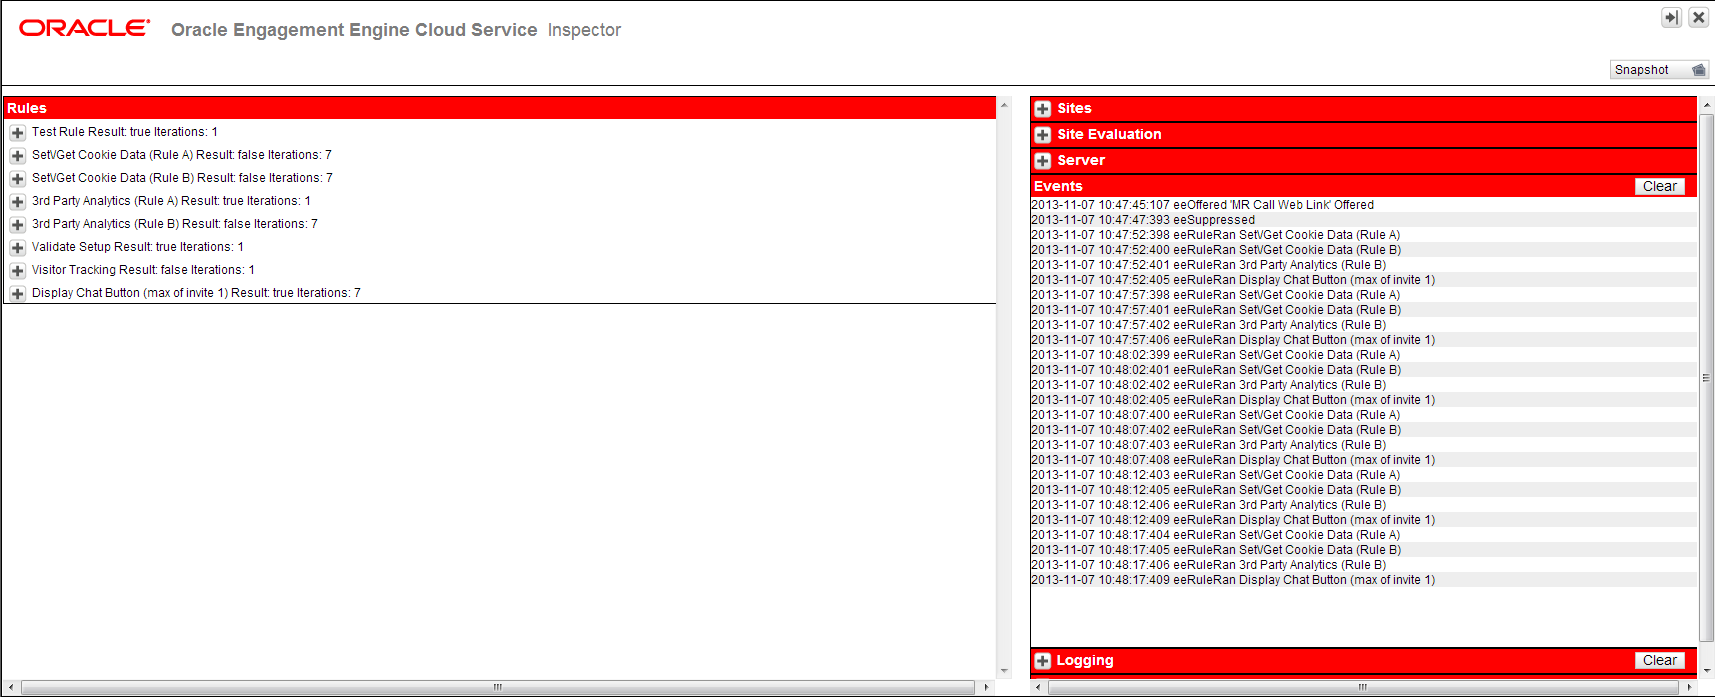
Inspector tool
The left hand side of the Inspector tool shows the Rules window. The right hand side shows a number of compressed windows that each provide further detail about Engagement Engine activity. You can expand these windows as required.
The windows that are displayed within Inspector are:
Rules: This provides technical information about the Rules that have run on this page in the current session. It displays a list of the Rules that have been evaluated. The list is displayed in the order that the Rules were initially evaluated on the page. If you click on the + button beside a Rule, Inspector displays further detail about that Rule including how often the Rule Runs, and what Conditions and Actions are associated with the Rule.
Note: If a Rule does not run due to server-side Conditions, that Rule is not sent from the Engagement Engine server to the visitor’s browse, and so is not displayed in the Rules window.
Sites: This provides information about the Site with which the current page is associated, based on Site Evaluation Order and Site Conditions. This window displays the following fields:
Site Id: This is the Site ID for the site currently displayed.
Site Name: This is the name of the Site currently displayed.
Site Evaluation Order: This is the Site Evaluation Order of the Site currently displayed.
Suppress Invites While on Chat/Call?: This indicates whether the Site has been configured to suppress invitations while the customer is on a chat or a call.
Publish Date: This is the last date that the currently displayed Site was published.
Current Page URL: This is the URL of the page the visitor is currently viewing,
IP Address: This is the IP address of the visitor.
Time on Page: This is the length of time the visitor has been viewing the current page.
Time on Site: This is the length of time that the visitor has been browsing on the Site.
Visitor Browser: This is information about which browser the visitor is using to view the Site.
Time Since Last Mouse Move: This is the length of time that the visitor’s mouse has been inactive. This is reset each time the mouse moves.
Site Evaluation: This provides information about which Sites were evaluated and whether the Site Conditions for these Sites were evaluated as true or false. There are three sections in this window:
Sites Evaluated With: This displays the three values that Site Conditions compare against; IP Address, Page Title, and URL.
Failed Site: This lists the Sites where there was no match and displays which Site Conditions were checked for these Sites.
Matched Site: This displays the Site Name and Site ID for the Site where the site values did match with the Site Conditions.
Note: If you have stopped evaluation for a Site, it is displayed in the Failed Site section of this window.
Server: This provides information about the server that handled the Rules request for the current page. This window displays the following fields:
Visitor Id: This is the unique visitor ID assigned to the current visitor.
Service Id: This is an internal ID that is used for troubleshooting purposes.
Load Time: This is the server time at which the page load request was received.
Start Time: This is the server time at which the visitor’s session started.
Session Id: This is the unique ID assigned to the visitor’s session.
Page Peek Enabled: This is whether Page Peek has been enabled for your account.
Host: This is the name of the host server that has been handling Rules requests.
Reset Retailer Time: This is the server time when the retailer was last reset. The retailer is reset each time a Site is published.
JVM Start Time: This is the server time at which the server was last restarted.
Events: This provides information about the events that have been triggered by Rules and Invites on the current page. This window updates in real-time and you can clear the contents of this window by clicking on the Clear button.
Logging: This displays any log entries that have been made while on this page. This includes system log entries and any custom log entries that have been made as a result of a Rule Action. Logging data is only available from pages that have been tagged to use atgsvcs-test.js. This window updates in real-time and you can clear the contents of this window by clicking on the Clear button.
Custom Data: This provides information about what data is currently held in the custom data fields.
The data displayed by Inspector is live data. The information displayed in each of the windows is updated as soon as new information relevant to each window is generated.
You can take a snapshot of the current data by clicking on the Snapshot button. This creates a new tab which contains all of the information in each of the windows as it was when the button was pressed. Inspector can capture a maximum of 5 snapshot tabs at any one time.
