Understand the Building Blocks of Oracle IoT Asset Monitoring Cloud Service
The Oracle IoT Asset Monitoring Cloud Service application includes several artifacts to help create a digital twin version of your business, and to help monitor and manage all your organizational assets.
The following sections introduce some of the key building blocks of the Oracle IoT Asset Monitoring Cloud Service application:
Organizations
Organizations are digital twin versions of your business. These are digital placeholders for the various heterogeneous entities that you have in your business, the locations where these entities operate from, and the associated users of these entities.
An organization contains digital versions of all the IoT-enabled assets that are part of your business operations. An organization is also associated with its authorized set of users. Predefined roles determine the privileges of each application user.
Your application can contain one or more organizations. For example, businesses often divide organizational operations based on geography. The following image shows a business divided into regions. Each region, Asia-Pacific, Europe, and North America has its own set of assets and users.
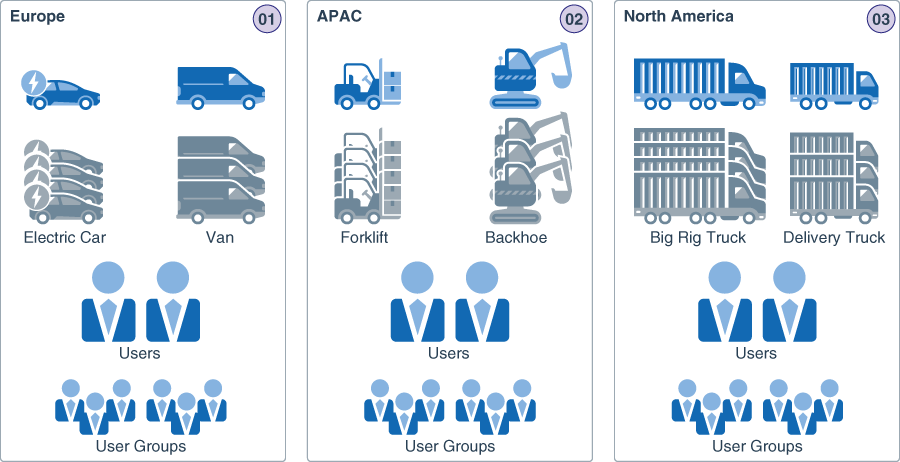
You may also want to have multiple organizations if you manage several clients, and you need to separate these clients into sub-tenants, so that each sub-tenant has its own set of assets and users.
The following sections include more information on organizations:
Groups
You can further subdivide a hierarchical organization into groups. For example, if an organization has two different set of products, you can create two distinct groups for each product with each group containing its own set of assets.
A group is a collection of similar assets under a single administration. You can group assets and authorize a single user or group of users to control the asset group. You can create asset groups based on your business needs. For example, you can create an asset group that contains all electrocardiogram (EKG) machines in a hospital. Alternatively, you may want to group the different assets present on a single floor under one group.
The following image shows some examples of hierarchical groups in an organization. The first group divides the assets by manufacturer (Asia, Japan, Manufacturer1 and Manufacturer2), the second group creates subgroups based on location (USA, West, CA, SF and LA), and the third group subdivides assets based on the product (Cars, Midsize, Brand1, Gas and Hybrid).
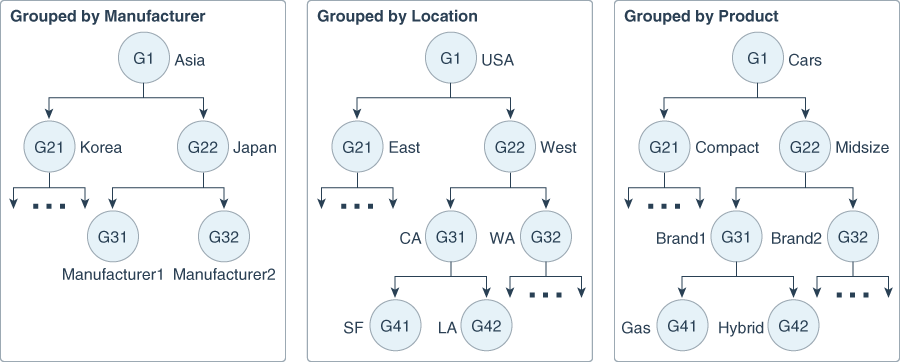
The assets contained in a group can be static or dynamic. You can either add assets manually to a group, or specify a filter criteria that dynamically selects the assets. For example, you can create a filter group for all assets of a particular asset type.
The following sections include more information on groups:
Assets
An asset is any leased or owned resource whose availability at the right time and place is important for your business operations and profitability. Use Oracle IoT Asset Monitoring Cloud Service to manage both your indoor and outdoor assets.
Work with Your Assets includes detailed information on working with your assets.
Simulate Asset Sensors with the Built-In Simulator includes information on creating asset simulations to test and understand Oracle IoT Asset Monitoring Cloud Service features without having to connect real devices.
Asset Types
The asset type defines the various attributes that identify an asset, and includes the sensor attributes that can be associated with the asset. A forklift asset type, for example, may include sensors for GPS coordinates, temperature, vibration, and oil viscosity.
Asset types also define asset actions and custom attributes. For example, if the asset type includes the power on/off action, you can directly power on or power off your device from the asset page. Custom attributes include attributes that vary between assets of a particular asset type, such as the asset serial number.
The following sections include more information on asset types:
Metrics and KPIs
Metrics or KPIs (Key Performance Indicators) help you track key metrics for your monitored assets, such as assets connected, assets available, and assets utilization. You can also create custom KPIs to track the metrics that are relevant to your business processes. So, for example, you can create a metric to track the average hourly temperature reported by a temperature sensor. You can also aggregate the metrics for various assets in your organization or group. So, for example, you can aggregate the average fuel level across all your forklift assets.
Track your metrics using asset-level, group-level and organization-level dashboards. You can also track metrics in the map view for the assets visible in the map context.
Places
Create places to define the storage and usage locations of your asset. You can search for your places in the map view and zoom into the available assets. If an asset moves out of its permitted place, Oracle IoT Asset Monitoring Cloud Service can generate an incident that is reported to the operations manager.
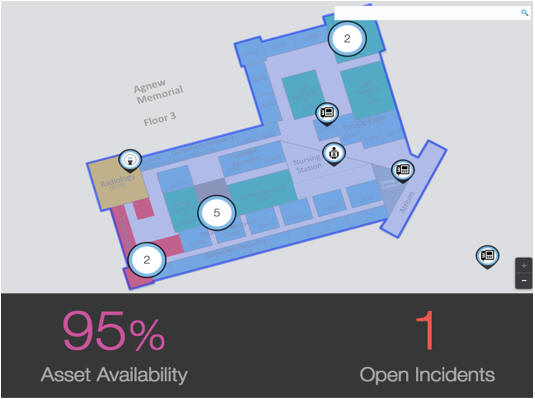
Create outdoor places by drawing a geofence on the map. For indoor places, you can additionally make use of floor plans and altitude data.
The following image shows a place created with a floor plan:
Create and Manage Places includes detailed information on creating and managing places.
Rules
Create rules to generate incidents, warnings, or alerts based on location, threshold, or alert conditions. So, for example you can create a location rule to generate an incident when an asset moves out of its designated location. You can create a threshold rule, say, to generate an alert when a pump device reports a blocked filter.
You can also use rules to trigger asset actions. For example, you can configure a rule to power off an overheating asset.
-
Incidents: Use incidents to report issues and work with the maintenance staff for resolutions.
-
Alerts: Use alerts to trigger other rules, or to pass messages to integrated enterprise applications.
-
Warnings: Use warnings to create a log of issues that don’t require your immediate attention.
-
Actions: Use asset actions to execute device-related actions for your asset.
Use Rules to Monitor and Maintain Assets includes detailed information on configuring rules.
The following sections provide more information on incidents, warnings, and actions:
Anomalies
Use anomalies to detect deviations from normal asset behavior, and to flag and address device issues in time. You can create point-in-time anomalies that look for deviations in a KPI value. For example, point-in-time anomalies can help detect an HVAC device that is overheating . You can also use pattern-based anomalies to look for telltale patterns in sensor data generated by an asset. For example, you may use pattern-based anomalies to look for vibration anomalies in a forklift asset.
You can also use anomalies in rules to trigger incidents, warnings, asset actions, or alerts.
The following sections provide more information on anomalies:
Predictions
Predictions use historical and transactional data to identify risks to your assets. You can either use internal Oracle Internet of Things Intelligent Applications Cloud data or import and use external device data to help make predictions for your asset.
Predictions help warn you of impending asset failure in advance. Preventive maintenance can help save the costs associated with asset breakdown or unavailability.
The following sections provide more information on predictions:
Map View
The map view lets you locate assets on the map. Assets can appear independently, or clustered together, depending on your zoom level in the map. Click a cluster on the map to display the individual assets. Click an asset to view asset details, such as the location history or the incidents associated with the asset.
A KPI ribbon appears in the lower pane of the map view. The KPI ribbon shows KPI metrics for the assets in your current view. Metrics include built-in metrics such as Asset Availability and Asset Utilization. You can also add custom KPI metrics per your business needs.
The following image shows a map view with asset clusters and the KPI ribbon:
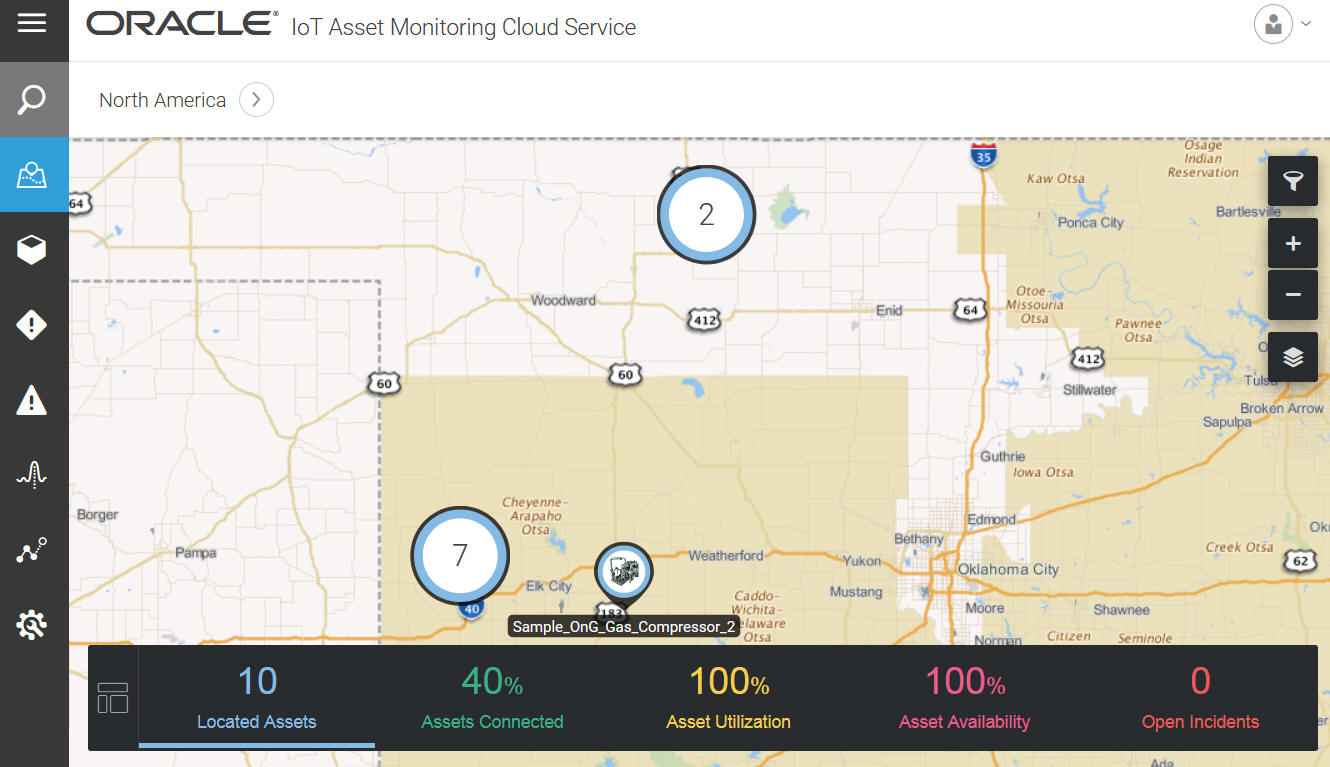
Here are some of the built-in KPI metrics that appear in the map view:
-
Located Assets: Shows the total number of assets located in the map.
-
Assets Connected: Shows the percentage of assets heard from in the last one hour.
-
Assets Utilization: Shows the percentage of assets that are currently utilized. An asset should be out of its designated storage location to be counted as utilized.
-
Asset Availability: Shows the percentage of assets that are currently available. An available asset is one that does not have an outage incident reported against it.
-
Open Incidents: Shows the current count of open asset incidents or issues.
The Operations Center and Locate Your Assets in the Map View includes more information on locating your assets in the map.
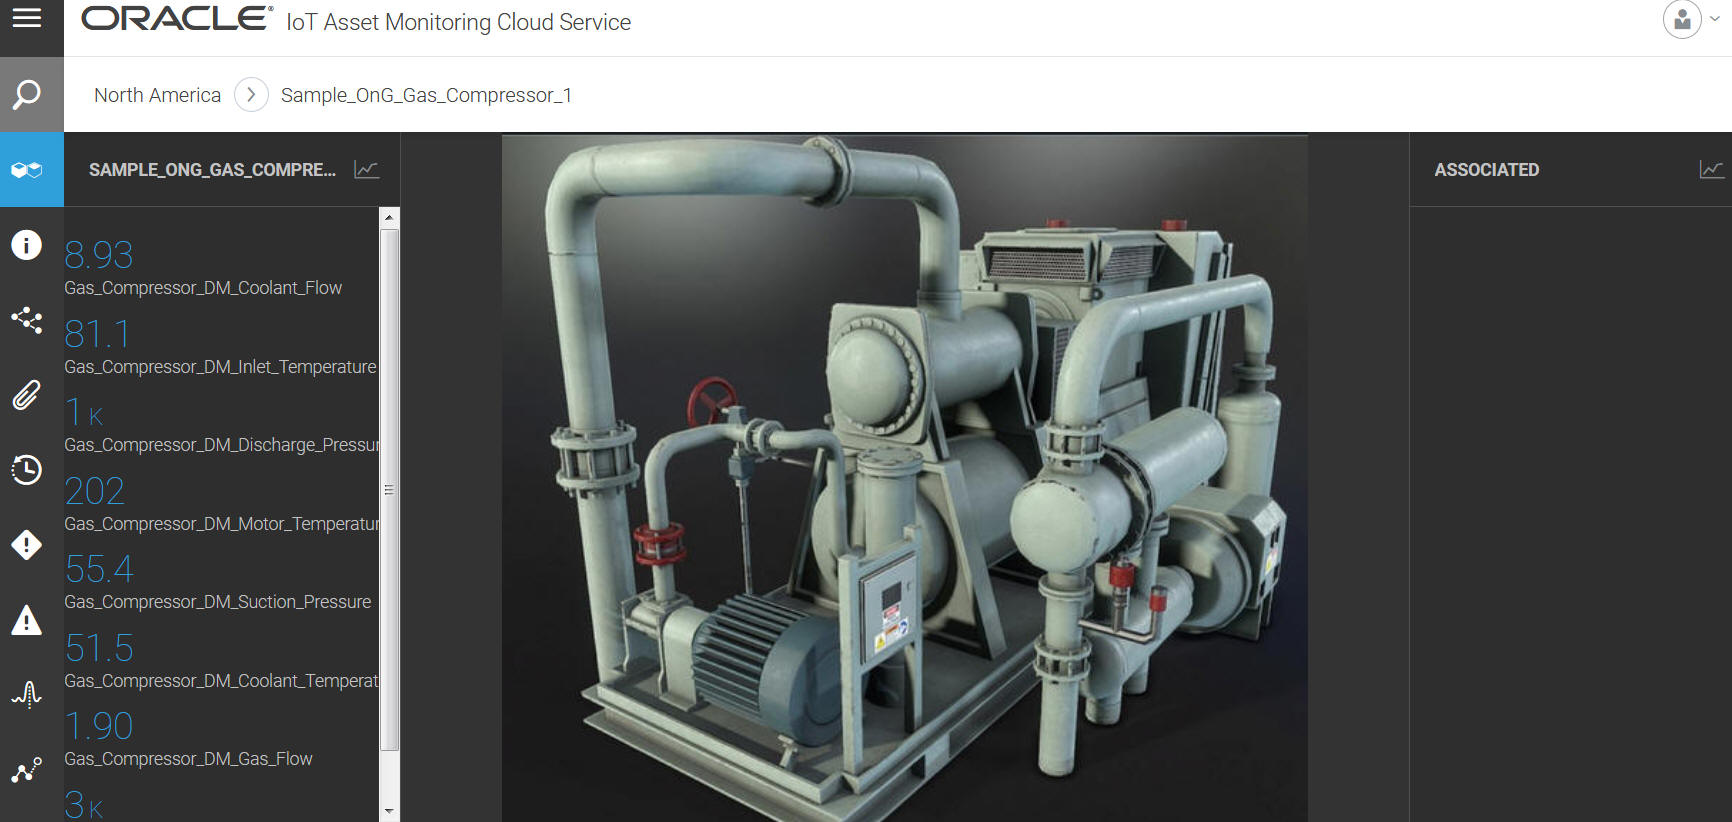
The following image shows the individual asset details that appear when you click an asset in the map:
Dashboards
Oracle IoT Asset Monitoring Cloud Service dashboards let you track key metrics for your monitored assets, such as assets connected, assets available, and assets utilization. You can create dashboards at the organization level, group level, or individual asset level.
If you have additionally created user-defined metrics for your assets, you can add these to your respective asset dashboards. For group and organization-level dashboards, you can display the metric values aggregated over all your assets in the group or organization. For example, you may choose to display the average fuel level across all your forklift assets.
The following section provides more information on dashboards: Track Individual and Cumulative Asset Metrics Using Dashboards