Using the Call Graph
The Call Graph window displays two views of the calling relationships between functions in the classes. A tree view shows the functions called from a selected function, or the functions that call that function. A graphical view shows the calling relationships using arrows between the called and calling functions.
-
In the quote.cc file, right-click on the main function and choose Show Call Graph.
-
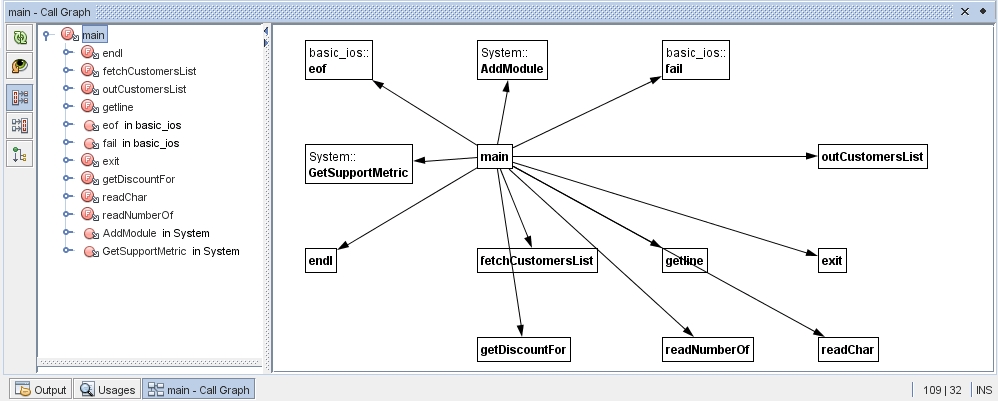
The Call Graph window opens and displays a tree view and a graphical view of all of the functions called from the main function.

If you do not see all of the functions shown in the screen shot, click Who is Called From the Function button on the left side of the Call Graph window to show who is called from the main function.
-
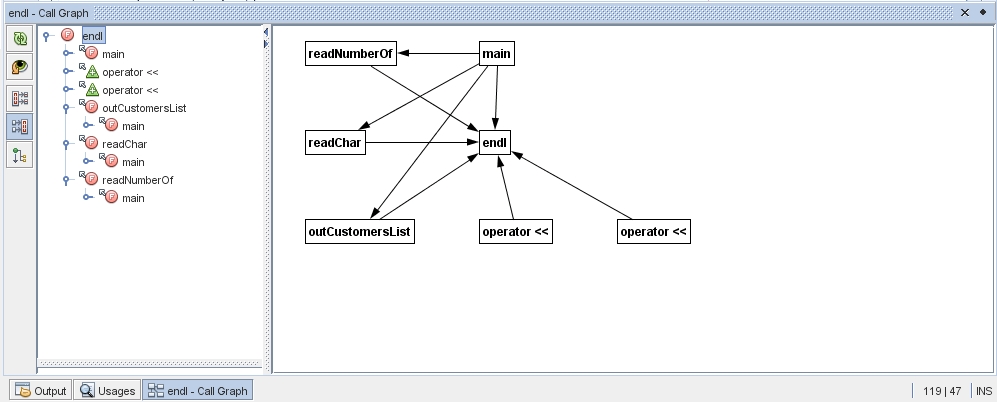
Expand the end1 node to display the functions called by that function. Notice that the graph is updated to add the functions called by end1.
-
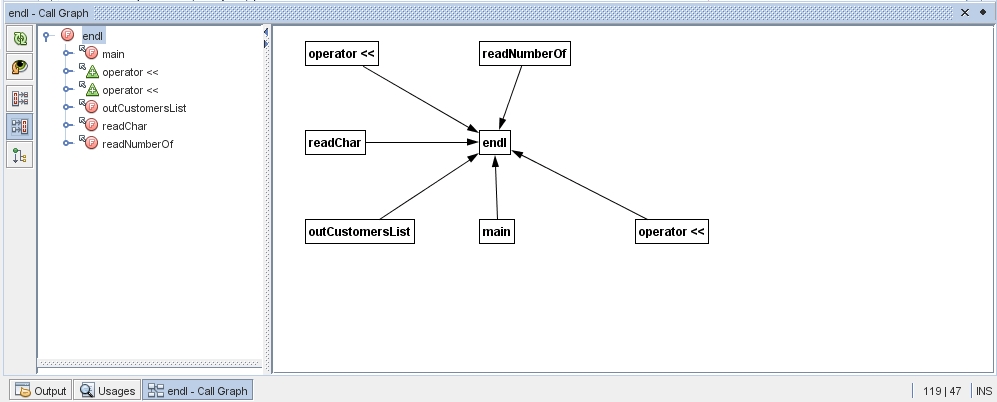
Select the end1 node and click the Bring Into Focus button on the left side of the window to focus on the endl function, then click the Who Calls This Function button to view all of the functions that call the end1 function.

-
Expand some of the nodes in the tree to see more functions.
