Using the Indicator Controls
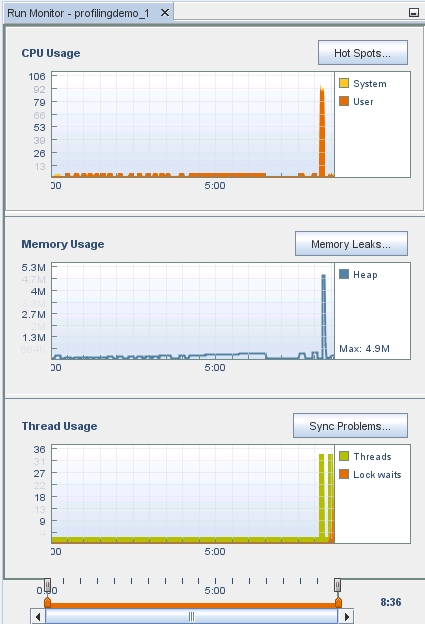
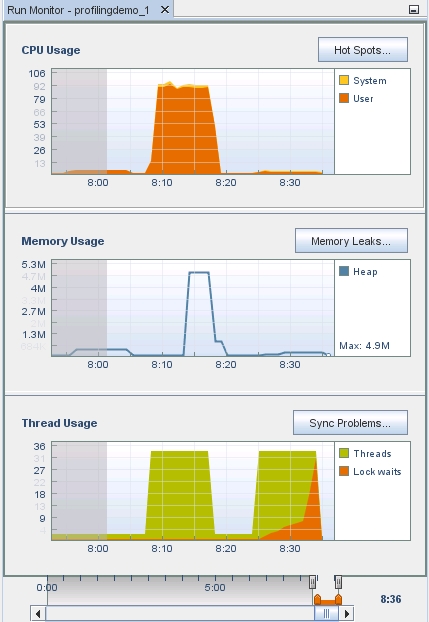
At the bottom of the Run Monitor window, there are sliders for controlling your view of the graphs: View slider, Details slider, and Time slider. The controls are also used for filtering data. The following image labels the controls.

-
Place your mouse cursor over the end points of the sliders for information about the sliders.
-
Click and hold the mouse button on the Time slider, the horizontal scroll bar at the bottom. All the graphs slide in unison so you can see CPU, memory, and threads at any given time and to see the relationships between them.

Drag the time slider from left to right to see the complete run.
-
Move your mouse to the view slider, the controls that overlay the time units. The view slider controls the part of the run time displayed in the indicator.
-
Click and drag the handles of the start point of the view slider to the beginning of the run. The indicators show the entire run. The effect is similar to zooming out. Notice that the time scroll bar is maximized when you select the complete run time, since you are already looking at all the data.
-
Drag the view slider's start point to where the PTHREAD_MUTEX_DEMO starts. As you drag the handle, the indicators zoom in to focus on this area. Notice that the scroll bar can again be used to scroll the run time.
-
Place your mouse cursor over the end points of the orange-colored details slider for a description of how to use the slider. The details slider controls enable you to select a portion of the runtime for examining the detailed information.

Drag the details slider's start point handle past the view slider's start point. Notice that the indicators grey out the area in from the of the detail slider's start point. This gives a highlighting effect to the graph between the start and end points. When you click an indicator's detail button, the details tab shows the data for the area highlighted.
-
Drag the start point of the details slider back to the beginning so you can see all the data.
Note - You can slide either the starting handle or ending point handle for the view slider and the details slider, so you can view and get details at any time of your run.