Exploring Thread Usage
The Thread Usage indicator shows the number of threads in use by your program, and any moments where a thread has to wait to get a lock in order to proceed with its task. This data is useful for multithreaded applications, which must perform thread synchronization in order to avoid expensive wait times.
-
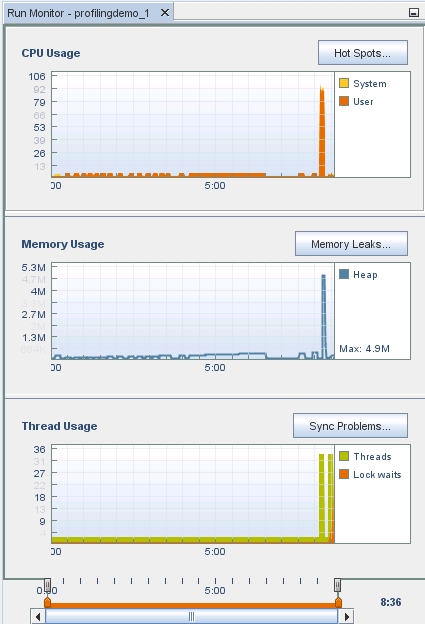
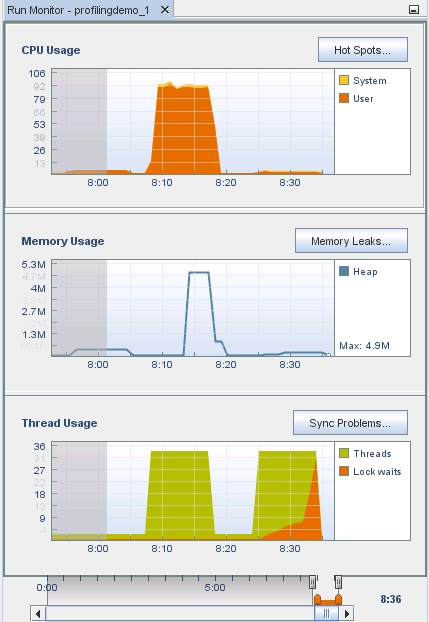
The Thread Usage indicator shows the number of threads running during a project's run time. Slide the time slider back to the beginning and notice the number of threads is 1 until the Parallel Demo starts. In the following image, this is at 8:07, with a jump of 1 to 32 threads.

-
Move the view slider endpoint handle to where the Parallel Demo just starts.

Notice that in the CPU Usage and Memory Usage indicators for the same time period has the single thread performing some activity that uses CPU time and memory. This corresponds to the Sequential Demo portion, in which the main thread writes to a file and then performs some calculations sequentially. CPU and memory usage both decrease when the program waits for the user to press Enter and the number of threads remains at 1.
-
Slide the time slider to the right until you see the two points where the threads increase in number.
The increase in threads at 8:07 corresponds to the Parallel Demo portion of the project running. The main threads starts additional threads to the work of writing to a file and performing calculations in parallel. Notice the increase in memory usage and CPU usage, but the two tasks are completed in much less time.
-
The number of threads returns to 1 after the Parallel Demo threads finish, and the main thread waits for you to press Enter. The thread count increases again as the Pthread Mutex Demo portion of the program runs.
Notice that a lock waits appears, shown in orange, during the Pthread Mutex Demo portion. The Pthread Mutex Demo uses mutual exclusion locks to prevent overlapping access to certain functions by multiple threads, which causes the threads to wait to obtain a lock.
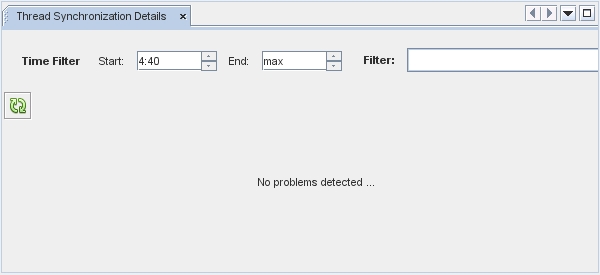
Click the Sync Problems button to display details about thread locks in your project. The Thread Synchronization Details window opens and lists functions that had to wait to obtain a mutex lock. Also displayed are metrics for the number of milliseconds that the function spent waiting and the number of times the function had to wait for a lock. This example had no sync problems.

If you click the Sync Problems button while the program is running, you might need to click the refresh button
 to update the display with the latest thread lock
information.
 -
Click the Wait Time column to sort the functions in order of time spent waiting.
-
Click the Lock Waits column to sort the functions by the number of times a thread was waiting in the functions.
-
Double-click a function to open the source file in the editor where the function responsible for locking a memory location. The metrics for Wait Time and Lock Waits are displayed in the left column f the source file. Place your mouse over the metrics to see the details, which matches what is shown in the Thread Synchronization Details window.
-
Right-click on the metrics and deselect Show Profiler Metrics. The metrics are no longer displayed in the source editor for any of the profiling tools. To display the metrics again, choose View in the IDE menu bar and select Show Profiler Metrics.