Building and Running the ProfilingDemo_1 Project
To build and run ProfilingDemo_1:
-
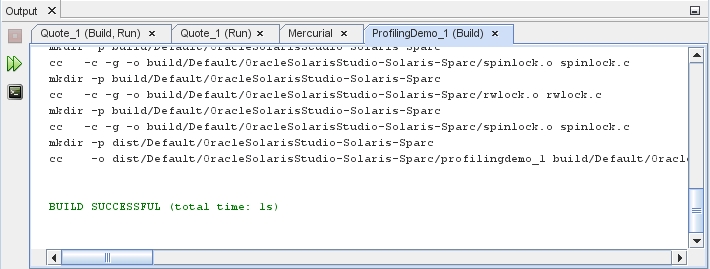
Right click the ProfilingDemo_1 project node and select Build.
The Output window shows the results of the build.

-
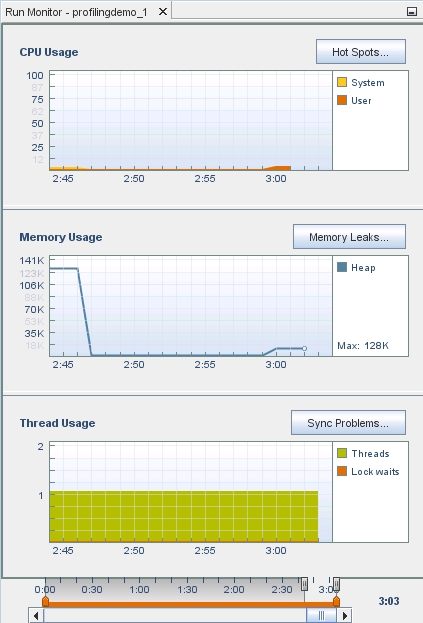
Right-click the ProfilingDemo_1 project node and select Run. The Run Monitor window opens to display indicators with dynamic graphs for CPU Usage, Memory Usage, and Thread Usage.

Notice in the Output window, the ProfilingDemo_1 program tells you what it is doing, so you can match it to the data that the IDE is graphically representing in the tools. For example, the program displays how much memory it is allocating, performs calculations, and then frees memory. You can see the graph reflect this activity.
-
Press Enter each time you are requested until the program is finished.
-
Hover your mouse cursor over the indicators to see tooltips explaining what each graph represents. Each indicator includes a button for more detailed information, which will be explored in later sections.