Exploring CPU Usage
The CPU Usage graph shows the percentage of the total CPU time used by your application during its run.
-
Click the CPU Usage Hot Spots... button to display details about the CPU Time.
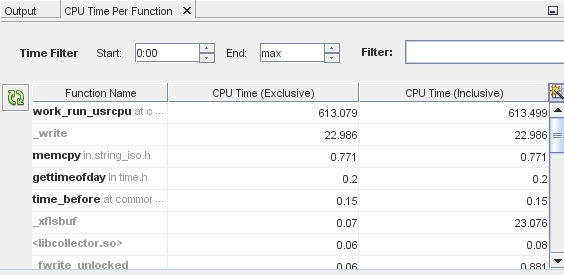
The CPU Time Per Function window opens to display the functions of the program, along with the CPU time used by each function. The functions are listed in order of CPU time used, with the function that used the most time listed first. If the program is still running, the time initially displayed is the time consumed at the moment you clicked the graph.

-
Click the Function Name column head to sort the functions alphabetically.
Notice the difference between the two columns of CPU Time. CPU Time (Inclusive) shows the total CPU time spent form the time the function is entered until the time it is exited, including the time of all other functions that are called by the listed function. CPU Time (Exclusive) shows the time used only by the specific function, not including any functions that it calls.
-
Click the CPU Time (Inclusive) column head to place the most time-consuming functions back at the top.
Notice that in our example, the work_run_usrcpu() function has 613.079 CPU Time (Exclusive) versus a 613.499 CPU Time (Inclusive). This means that a small amount of the CPU time was actually used by other functions that it calls, but the work_run_usrcpu() function itself used most of the time.
-
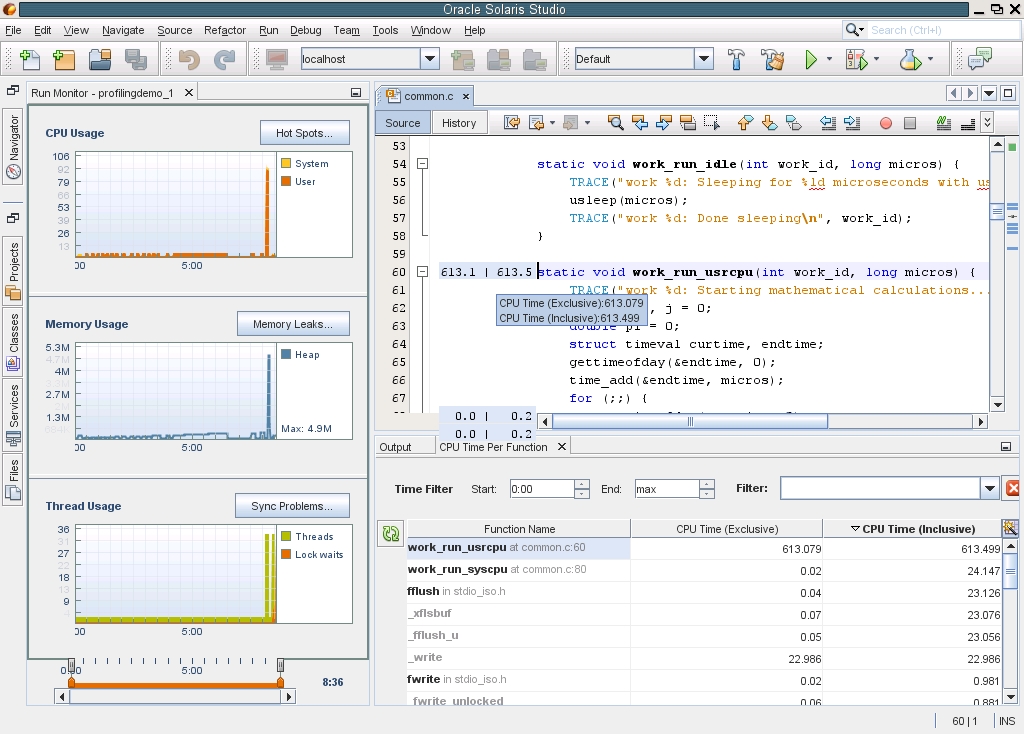
Some of the functions are listed in bold. You can go to the source file that calls these functions. Double-click the work_run_usrcpu() function.

The common.c file opens, with the cursor resting on the work_run_usrcpu() function, line 60. Some numbers are displayed in the left margin for this line.
-
Place your cursor over the numbers in the left margin. The numbers are the same metrics for exclusive and inclusive CPU time for the functions displayed in the CPU Time Per Function window. The metrics are rounded to the nearest tenth, but the unrounded value pops up when you hover the mouse over them. Metrics for CPU-consuming lines such as the for() loop that does calculations within the work_run_usrcpu() function are also shown in the common.c source file.
-
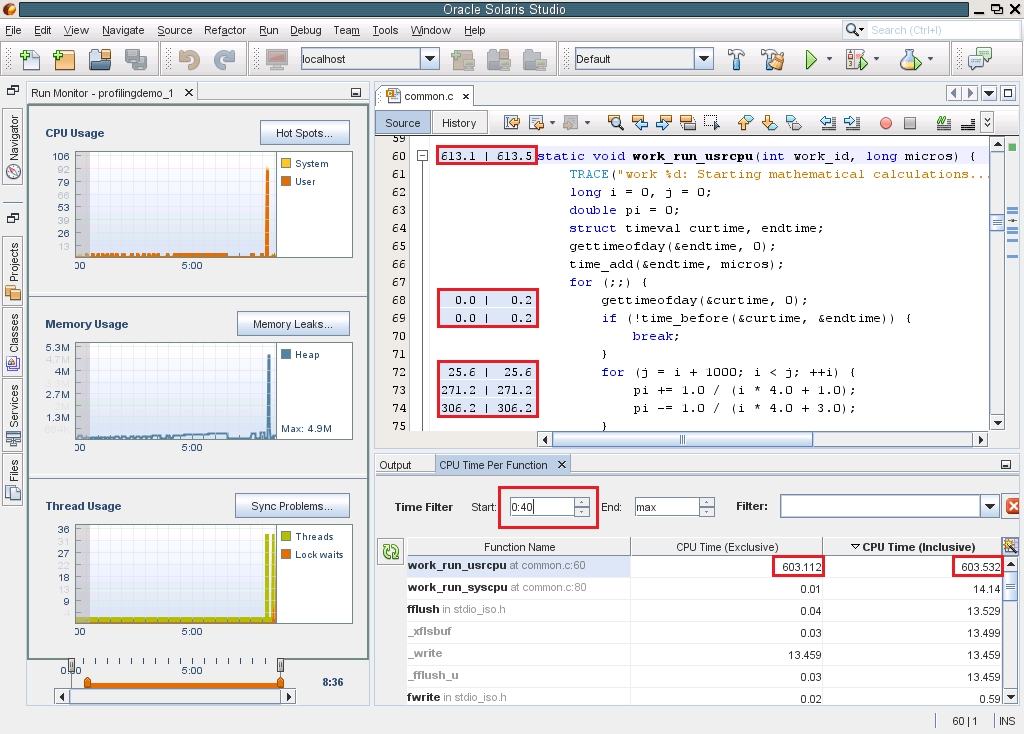
In the CPU Time Per Function window, change the Time Filter start time to 0:40 by either typing the time and pressing Enter, or using the arrows to scroll through the seconds. The graphic indicators change just as they did when you moved the handles on the data filtering control. If you drag the handles, the Time Filter settings in the CPU Time Per Function window are updated to match. More importantly, the data shown for the functions in the table is updated to reflect the filter so only the CPU time used during that time period is shown.

-
You can also filter for data that meet a certain metric. Right-click on the CPU Time (Exclusive) metrics for work_run_usrcpu(). In our example, right-click the 603.112 in the CPU Time Per Function window. Select Show only where > CPU Time (Exclusive) == 603.112. All the rows are filtered away, and only the row whose exclusive CPU time is equal to 603.112 is displayed.