| Oracle® Retail Demand Forecasting User Guide for the RPAS Fusion Client Release 16.0 E91109-03 |
|

 Previous |
 Next |
| Oracle® Retail Demand Forecasting User Guide for the RPAS Fusion Client Release 16.0 E91109-03 |
|
Previous |
Next |
Oracle Retail Demand Forecasting (RDF) is a statistical and promotional forecasting solution. It uses state-of-the-art modeling techniques to produce high quality forecasts with minimal human intervention. Forecasts produced by the RDF system enhance the retailer's supply-chain planning, allocation, and replenishment processes, enabling a profitable and customer-oriented approach to predicting and meeting product demand.
Today's progressive retail organizations know that store-level demand drives the supply chain. The ability to forecast consumer demand productively and accurately is vital to a retailer's success. The business requirements for consumer responsiveness mandate a forecasting system that more accurately forecasts at the point of sale, handles difficult demand patterns, forecasts promotions and other causal events, processes large numbers of forecasts, and minimizes the cost of human and computer resources.
Forecasting drives the business tasks of planning, replenishment, purchasing, and allocation. As forecasts become more accurate, businesses run more efficiently by buying the right inventory at the right time. This ultimately lowers inventory levels, improves safety stock requirements, improves customer service, and increases the company's profitability.
The competitive nature of business requires that retailers find ways to cut costs and improve profit margins. The accurate forecasting methodologies provided with RDF can provide tremendous benefits to businesses.
A connection from RDF to Oracle Retail's Planning and Optimization suite is built directly into the business process by way of the automatic approvals of forecasts, which may then be fed directly to any Planning and Optimization suite application. This process allows you to accept all or part of a generated sales forecast. Once that decision is made, the remaining business measures may be planned within an Planning and Optimization suite application such as Merchandise Financial Planning (MFP).
A number of challenges affect the ability of organizations to forecast product demand accurately. These challenges include selecting the best forecasting method to account for:
Level
Trending
Seasonal demand
Spiky demand
Generating forecasts for items with limited demand histories
Forecasting demand for new products and locations
Incorporating the effects of promotions and other event-based challenges on demand
Accommodating the need of operational systems to have sales predictions at more detailed levels than planning programs provide
One challenge to accurate forecasting is the selection of the best model to account for level, trending, seasonal, and spiky demand. Oracle Retail's AutoES (Automatic Exponential Smoothing) forecasting method eliminates this complexity.
The AutoES method evaluates multiple forecast models, such as Simple Exponential Smoothing, Holt Exponential Smoothing, Additive and Multiplicative Winters Exponential Smoothing, Croston's Intermittent Demand Model, and Seasonal Regression forecasting to determine the optimal forecast method to use for a given set of data. The accuracy of each forecast and the complexity of the forecast model are evaluated in order to determine the most accurate forecast method. You simply select the AutoES forecast generation method and the system finds the best model.
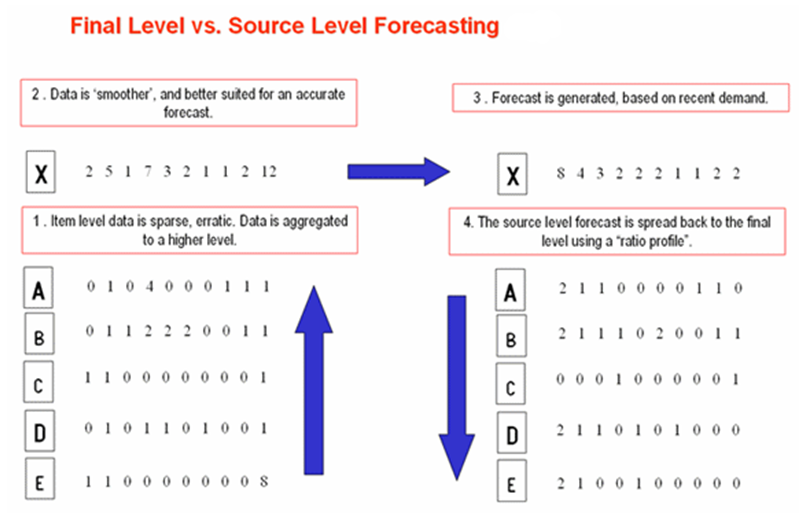
It is a common misconception in forecasting that forecasts must be directly generated at the lowest levels (final levels) of execution. Problems can arise when historic sales data for these items is too sparse and noisy to identify clear selling patterns. In such cases, generating a reliable forecast requires aggregating the sales data from a final level up to a higher level (source-level) in the hierarchy in which demand patterns can be seen, and then generate a forecast at this source-level. After a forecast is generated at the source-level, the resulting data can be allocated (spread) back down to the lower level, based on the lower level's (final level) relationship to the total. This relationship can then be determined through generating an additional forecast (interim forecast) at the final level. RDF can be set up to dynamically generate a profile based on the interim forecasts. Also, a non-dynamic profile can be generated and approved in Curve to be used as this profile. It is this profile that determines how the source-level forecast is spread down to the final level. For more information on Curve, refer to Chapter 18, "Curve Task".
Some high-volume items may possess sufficient sales data for robust forecast calculations directly at the final forecast level. In these cases, forecast data generated at an aggregate level and then spread down to lower levels can be compared to the interim forecasts run directly at the final level. Comparing the two forecasts, each generated at a different hierarchy level, can be an invaluable forecast performance evaluation tool.
Your RDF system may include multiple final forecast levels. Forecast data must appear at a final level for the data to be approved and exported to another system for execution.
RDF also forecasts demand for new products and locations for which no sales history exists. You can model a new product's demand behavior based on that of an existing similar product for which you do have a history. Forecasts can be generated for the new product based on the history and demand behavior of the existing one. Likewise, the sales histories of existing store locations can be used as the forecast foundation for new locations in the chain.
The RDF end user may be responsible for managing the forecast results for thousands of items, at hundreds of stores, across many weeks at a time. The Oracle Retail Predictive Application Server (RPAS) provides users with an automated exception reporting process (called Alert Management) that indicates to you where a forecast value may lie above or below an established threshold, thereby reducing the level of interaction needed from you.
Alert management is a feature that provides user-defined and user-maintained exception reporting. Through the process of alert management, you define measures that are checked daily to see if any values fall outside of an acceptable range or do not match a given value. When this happens, an alert is generated to let you know that a measure may need to be examined and possibly amended in a workbook.
The Alert Manager is a dialog box that is displayed automatically when you log on to the system. This dialog provides a list of all identified instances in which a given measure's values fall outside of the defined limits. You may pick an alert from this list and have the system automatically build a workbook containing that alert's measure. In the workbook, you can examine the actual measure values that triggered the alert and make decisions about what needs to be done next.
For more information on the Alert Manager, refer to the Oracle Retail Predictive Application Server User Guide.
Promotions, non-regular holidays, and other causal events create another significant challenge to accurate forecasting. Promotions such as advertised sales and free gifts with purchase might have a significant impact on a product's sales history, as can fluctuating holidays such as Easter.
Using Promotional Forecasting (an optional, add-on module to RDF), promotional models of forecasting can be developed to take these and other factors into account when forecasts are generated. Promotional Forecasting attempts to identify the causes of deviations from the established seasonal profile, quantify these effects, and use the results to predict future sales when conditions in the selling environment is similar. This type of advanced forecasting identifies the behavioral relationship of the variable you want to forecast (sales) to both its own past and explanatory variables such as promotion and advertising.
Suppose that your company has a large promotional event during the Back To School season each year. The exact date of Back To School varies from year to year, as a result, the standard time-series forecasting model often has difficulty representing this effect in the seasonal profile. The Promotional Forecasting module allows you to identify the Back To School season in all years of your sales history, and then define the upcoming Back To School date. By doing so, you can causally forecast the Back To School-related demand pattern shift.
For some retailers, an RDF implementation with causal forecasting is necessary. Whenever price discount, marketing information (TV, flyer) or space information (front isle) need to be factored in the forecast, causal forecasting is the right tool.
However, in RDF implementations without the causal capability, some floating events still exist. For instance, an increase in sales leading to Easter will happen even if there is no promotion specifically associated with Easter (chocolate bunnies sell more during Easter even though they are not specifically promoted). And because it does not happen in the same time period every year, the Easter spike will appear ’randomly' any time in March or April. The spike is baked in the seasonality of each item/store, making its prediction, timing and magnitude, inaccurate at best.
RDF is able to handle such situations, not only thru its causal capabilities, but also for baseline forecasting.
To do that, a set of events has to be defined. This usually happens at configuration time. Then, a user has to flag the periods where an event was active in the past (history) and in the future (forecast horizon). Once the dates are set up, the effect of the event is estimated based on past instances, and applied in the forecast horizon if the flag is active.
For the user interaction, that is the managing the periods when events were active, RDF provides the Floating Event Administration workbook. Its single worksheet lists events and you have the ability to flag periods when certain product/location combinations are active during an event.
For the majority of retailers, the business is managed using a calendar (364 days organized into 13 week quarters) that periodically includes an extra 53rd week so that the year end stays in about the same time of the year. It is useful to have some control over how this 53rd week will be managed within the forecasting system's time dimension. Management of this issue causes customers the pain, time and cost of configuring their data every few years that this happens.
The problem described has two implications. The first case is when two years – each with 52 weeks – of historical sales are available, and the retailer needs to forecast for the following year, which has 53 weeks. The second case is when one of the years of historical sales has 52 weeks, and the other has 53 weeks.
The correction for the extra week happens as part of generate, in particular when the baseline is written out. This is necessary, such that all additional effects (promo, price change, demand transference) are layered on top of the baseline.
The information RDF needs to handle a 53rd week is the name of the measure that indicates which week is the extra week. The measure is loaded or populated through user input, and it is stored in the Forecast Administration parameter called Extra Week Indicator Data Source. On the same view (Advanced Final and Source Level Parameters) there is also the measure Extra Week Interpret Method that indicates how to calculate the forecast value for a week that was flagged as 53rd or extra week.
RDF has the ability to calculate returns based on the unconstrained demand that it generates. The approach is based on the following assumptions:
All returned items are re-sellable; in other words there is no damage or decomposition.
Each week, the return is solely based on a previous week's sale, instead of weighting several weeks.
You need to enable the returns forecast generation, as well as input two parameters:
The percentage of the merchandise that was returned
The number of periods, t, from when the merchandise was sold until it was returned.
Given this information, the formula for the returns at time period t, is:
Returns(t) = Forecast(t- t) * percentage
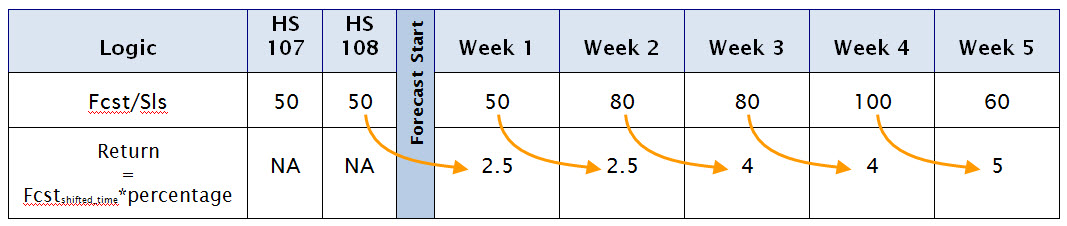
In Figure 1-2, the time shift is specified as 1 and the return rate is 5%. Given the forecast (Fcst), the returns are calculated as:
Returns(t) = Forecast(t-1) * 5%
|
Note: The returns for the first week of forecast are based on the latest week of historical sales (HS), since no previous forecast value is available. |
The parameters are set in the Forecast Administration Workbook and the Forecast Maintenance Workbook The returns forecast can be viewed in the Forecast Approval Workbook.
This section includes these topics:
The RDF application is a member of the Planning and Optimization suite, including other solutions such as Merchandise Financial Planning, Item Planning, Category Management, and Advance Inventory Planning. The Planning and Optimization suite applications share a common platform called the Oracle Retail Predictive Application Server (RPAS). RDF leverages the versatility, power, and speed of the RPAS engine and user-interface.
These features characterize RPAS:
Multidimensional databases and database components (dimensions, positions, hierarchies)
Product, location, and calendar hierarchies
Aggregation and spreading of sales data
Client-server architecture and master database
Workbooks and views for displaying and manipulating forecast data
Wizards for creating and formatting workbooks and views
Menus, quick menus, and toolbars for working with sales and forecast data
An automated alert system that provides user-defined and user-maintained exception reporting
Charting and graphing capabilities
More details about the use of these features can be found in the Oracle Retail Predictive Application Server User Guide and online help provided within your RDF solution.
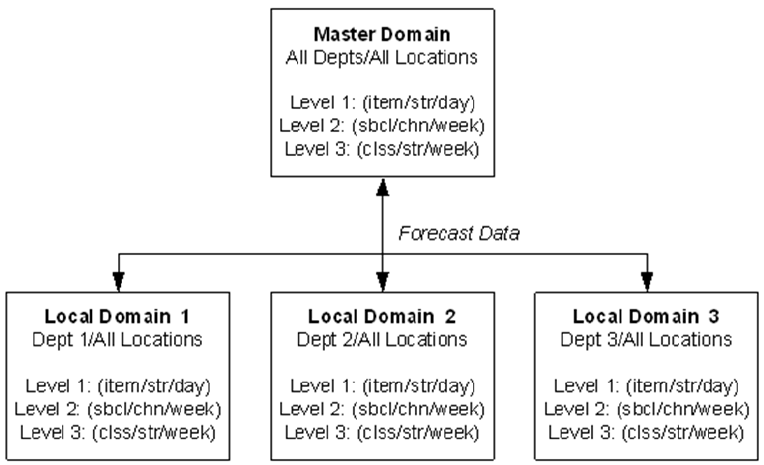
A simple domain environment supports isolated partitions of data. This type of environment does not allow for data to be aggregated across partitions into a single view. Whereas a global domain environment allows for data partitions to exist, however, certain data may be edited and viewed across partitions. Within this structure we refer to data within a partition as the Local domain (or sub-domain) and the view to data across multiple local domains as the Master domain. Figure 1-3 represents a global domain environment:
Within this structure, batch forecast results across all domains may be viewed within the master domain. This is achieved by passing measures with the same forecast birth date (date/time stamp) to each Local Domain when the batch forecast is generated. It is important to note that this cannot be achieved through the use of the Forecast Batch Run Workbook wizard. The Oracle Retail Demand Forecasting Implementation Guide provides more information on execution of batch forecast processes to support a global domain environment.
The RDF solution in a global domain environment also supports centralized administration and maintenance of forecast parameters in the Master domain. Additional details on the availability and limitations of all of the workbooks in the Master domain environment are provided in the following sections.
In addition to the standard RPAS Administration and Analysis workbook groups, there are several workbook groups that are associated with the RDF solution which may include: Forecast, Promote, Curve, or any Planning and Optimization suite application (available modules are based upon licensing agreement).
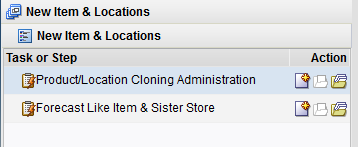
The New Items & Locations module consists of the workbooks and algorithms required to clone or copy history and model a new product's demand after an existing product.
For workbooks and views for this module, refer to Chapter 4, "New Item & Locations Task"
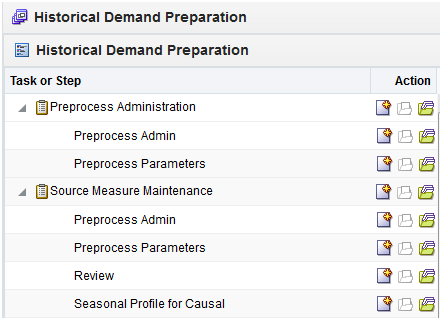
The Historical Demand Preparation module consists of the workbooks used to correct historical data prior to forecast generation when history does not represent general demand patterns. It is meant to automatically make adjustments to the raw POS (Point Of Sales) data so the next demand forecasts do not replicate undesired patterns.
For workbooks and views for this module, refer to Chapter 5, "Preprocessing Administration Task" and Chapter 6, "Source Measure Maintenance Task".
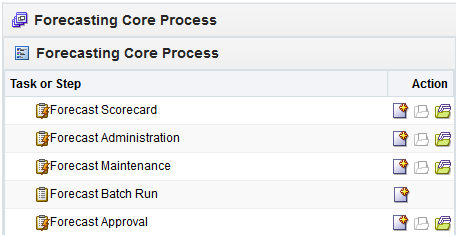
The Forecasting Core Process module refers to the primary RDF functionality and consists of the workbooks, measures, and forecasting algorithms that are needed to perform time-series forecasting.
Forecasting Core Process includes Curve workbooks and batch algorithms that are necessary for the creation, approval, and application of profiles that may be used to spread source-level forecasts down to final levels as well to generate profiles, which may be used in any RPAS solution. The types of profiles typically used to support forecasting are: store Contribution, Product, and Daily profiles. These profiles may also be used to support Profile-Based Forecasting, however; Curve may be used to generate profiles that are used by other Planning and Optimization suite applications for reasons other than forecasting. Profiles Types include Daily Seasonal, Lifecycle, Size, Hourly, and User-Defined profiles.
The Forecasting Core Process module also includes the batch forecasting routine and all of its component algorithms.
For more information on the Forecasting Core Process workbooks and views, refer to these chapters:
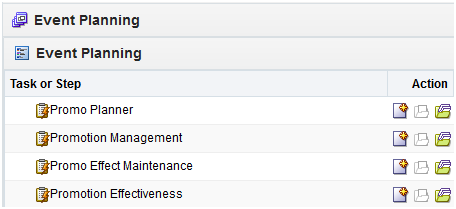
The Event Planning module consists of the workbooks and algorithms required to perform promotional forecasting, which uses both past sales data and promotional information (for example, advertisements, holidays) to forecast future demand.
For workbooks and views for this module, refer to Chapter 13, "Promote (Promotional Forecasting) Task".
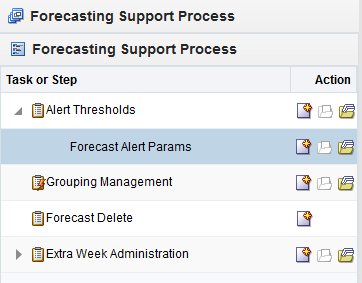
The Forecasting Support Process module consists of the workbooks that allow you to manage the thresholds used in the batch and workbook alerts included in RDF, as well as to manually delete a forecast.
For workbooks and views for this module, refer to these chapters:
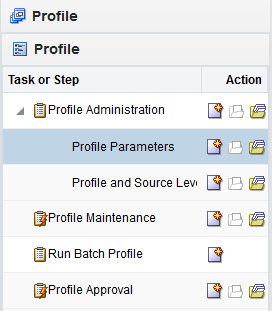
The Profile module consists of the workbooks that allow you to manage the promotion events used in the system's promotional forecasting processes and view/edit the system's analysis of the effects of these events on demand.
For workbooks and views for this module, refer to Chapter 18, "Curve Task".
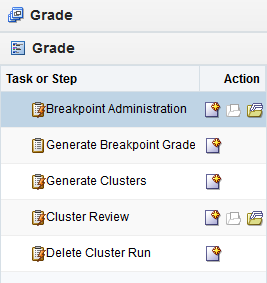
The Grade module consists of the workbooks and wizards that are necessary for clustering. Typically, a retailer may cluster stores over item sales to create logical groupings of stores based upon sales of particular products. This provides increased visibility to where products are selling, and it allows the retailer to make more accurate decisions in merchandising. Beyond this traditional use of clusters, Grade is flexible enough to cluster any business measure based on products, locations, time, promotions, customers, or any hierarchy configured in the solution.
For workbooks and views for this module, refer to Chapter 19, "Grade Task".
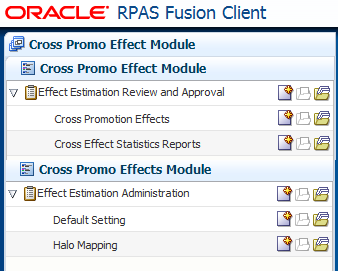
The Cross Promo Effect Module consists of the workbooks and algorithms that perform data mining which determines promotional Cannibalization, or Halo relationships, or both between items or groups of items.
For workbooks and views for this module, refer to Chapter 20, "Cross Promotional Effects Module (CPEM)."
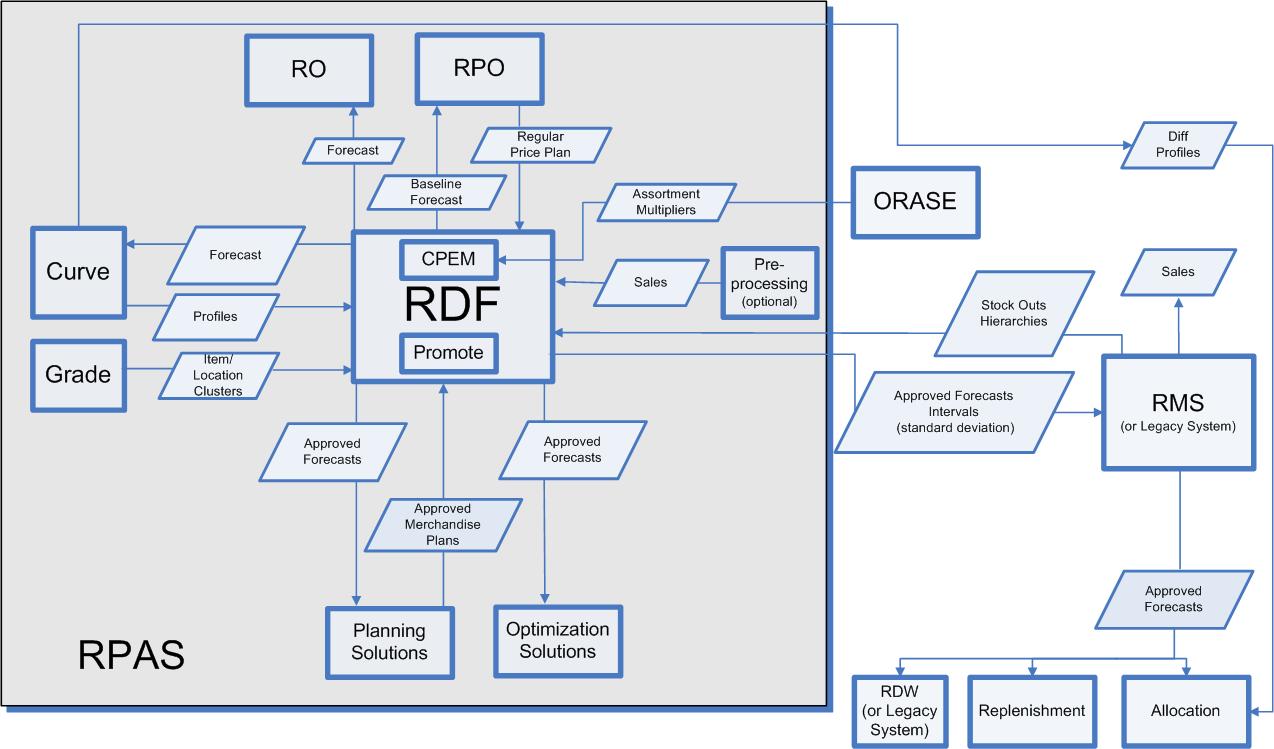
Oracle Retail has designed a forecasting solution separate from replenishment, allocation or planning. In order to provide a single version of the truth, it is crucial to free up your time and supply the tools to focus on the analysis of forecast exceptions, historical data, and different modeling techniques. This empowers you to make better decisions, thus improving overall accuracy and confidence in the forecast downstream.
Within the Oracle Retail Enterprise, Oracle Retail Merchandising System (RMS) supplies RDF with Point-of-Sale (POS) and hierarchy data that is used to create a forecast. Once the forecast is approved, it is exported to RMS in order to calculate a recommended order quantity. The RDF libraries can be used in any RPAS solution to create forecasts to support merchandise, financial, collaborative, and price planning processes.
GA integration scripts export RDF output to solutions including RMS, RPO, RO, and AIP. For other RPAS based solutions, integration scripts need to be customized by the implementer to reflect each retailer's specific needs.
Figure 1-12 illustrates an overview of RDF and the Oracle Retail Enterprise.
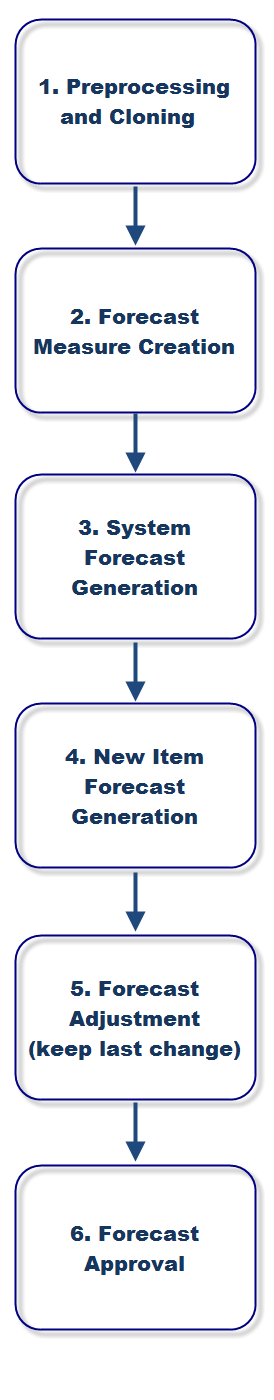
There are a number of core super-user/end-user forecasting steps in the RDF workflow that are essential for producing accurate forecasts for the millions of item and location combinations that exist in a domain.