The
/admin?op=stats operation returns the performance
statistics page, which lists the completion time for Assembler events. The page
has three sections: general statistics, worst event statistics, and per-event
statistics. Most fields on the performance statistics page are documented
within the page itself.
You
can reset the statistics by issuing the
/admin?op=statsreset operation. You can combine it with
the stats operation to get statistics and then reset them, for example:
op=stats&op=statsreset. You can also reset
statistics by clicking the
Reset statistics link in the
Last Reset Time row.
You can monitor the performance of an Assembler based web-app at two levels of details:
Assembler level performance monitoring
At this level, performance monitoring begins when a thread invokes the
Assembler.assemblemethod, and ends with the completion of this method. Therefore, at this level of performance monitoring,Assembler.assemble()is the root event. Additionally, this level monitors performance and the call hierarchy/call tree of important child events that are invoked directly or indirectly by theAssembler.assemblemethod.Servlet request level performance monitoring
At this level, performance monitoring begins when a HTTP request is received by a designated HTTP filter, called
PerfEventFilter, and ends as the request leaves this filter. This level has a broader scope of performance monitoring than the Assembler level, as this also monitors performance of threads that do not invoke theAssembler.assemblemethod. At this level of performance monitoring, the HTTP request/servlet request is the root event.
You can find the steps for configuring performance monitoring in Configuring the Assembler administrative servlet.
The general statistics section shows the overall event statistics A root event is the first method for which statistics were logged in the entire call hierarchy. The Number of Root Events is the number of times that a root event was invoked since the last reset time.
This section also shows the total time and local time statistics for root events. These are defined as follows:
Total Time is the amount of time that has elapsed between the start and the end of an event, including child events. The total time displays values for Median, 90th and 99th percentiles.
Local Time is the total time minus time spent in child events. Child events are the events that are called between the start and end of the current event.
In addition to the general event statistics, the page also includes the following sections.
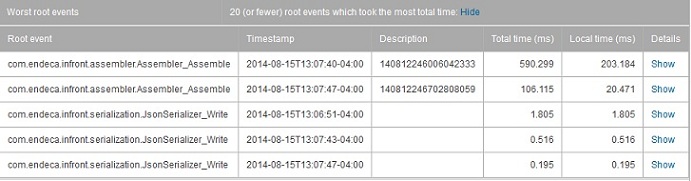
The Worst root events section displays the longest root events. It shows up to 20 root events that took the most time, sorted by total time in descending order.
The
Description column can show the request ID for
Assembler level root events or the URL for a servlet request level root event.
Any events created by a call to
PerfUtil.start() show an entry in the
Description column. The following picture shows
an Assembler level root event with a request ID in the
Description column.
The following picture shows a servlet request level root event with a URL in the Description column. Notice that the Details have been expanded. The expanded view shows the request ID in the Description column.
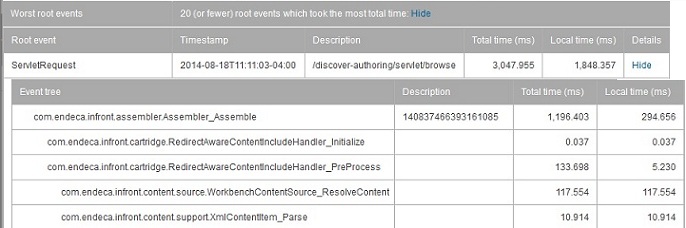
This request ID correlates an Assembler invocation with its
corresponding Dgraph requests, and is also logged in the Dgraph request log.
This request ID is only available when the
ContentItemAugmentAdapter is configured with a
RequestIdProvider. For information on this
configuration, see "Configuring logging for an Assembler Application" in the
Assembler Application Developer's
Guide
.
The Per event statistics sorted by total time - median section shows the statistics for individual events. Each event displays data for Total Invocations, Invocations per root event as well as Total time and Local time.
